S&P500 Daily Action Areas & Price Targets 17/8/26

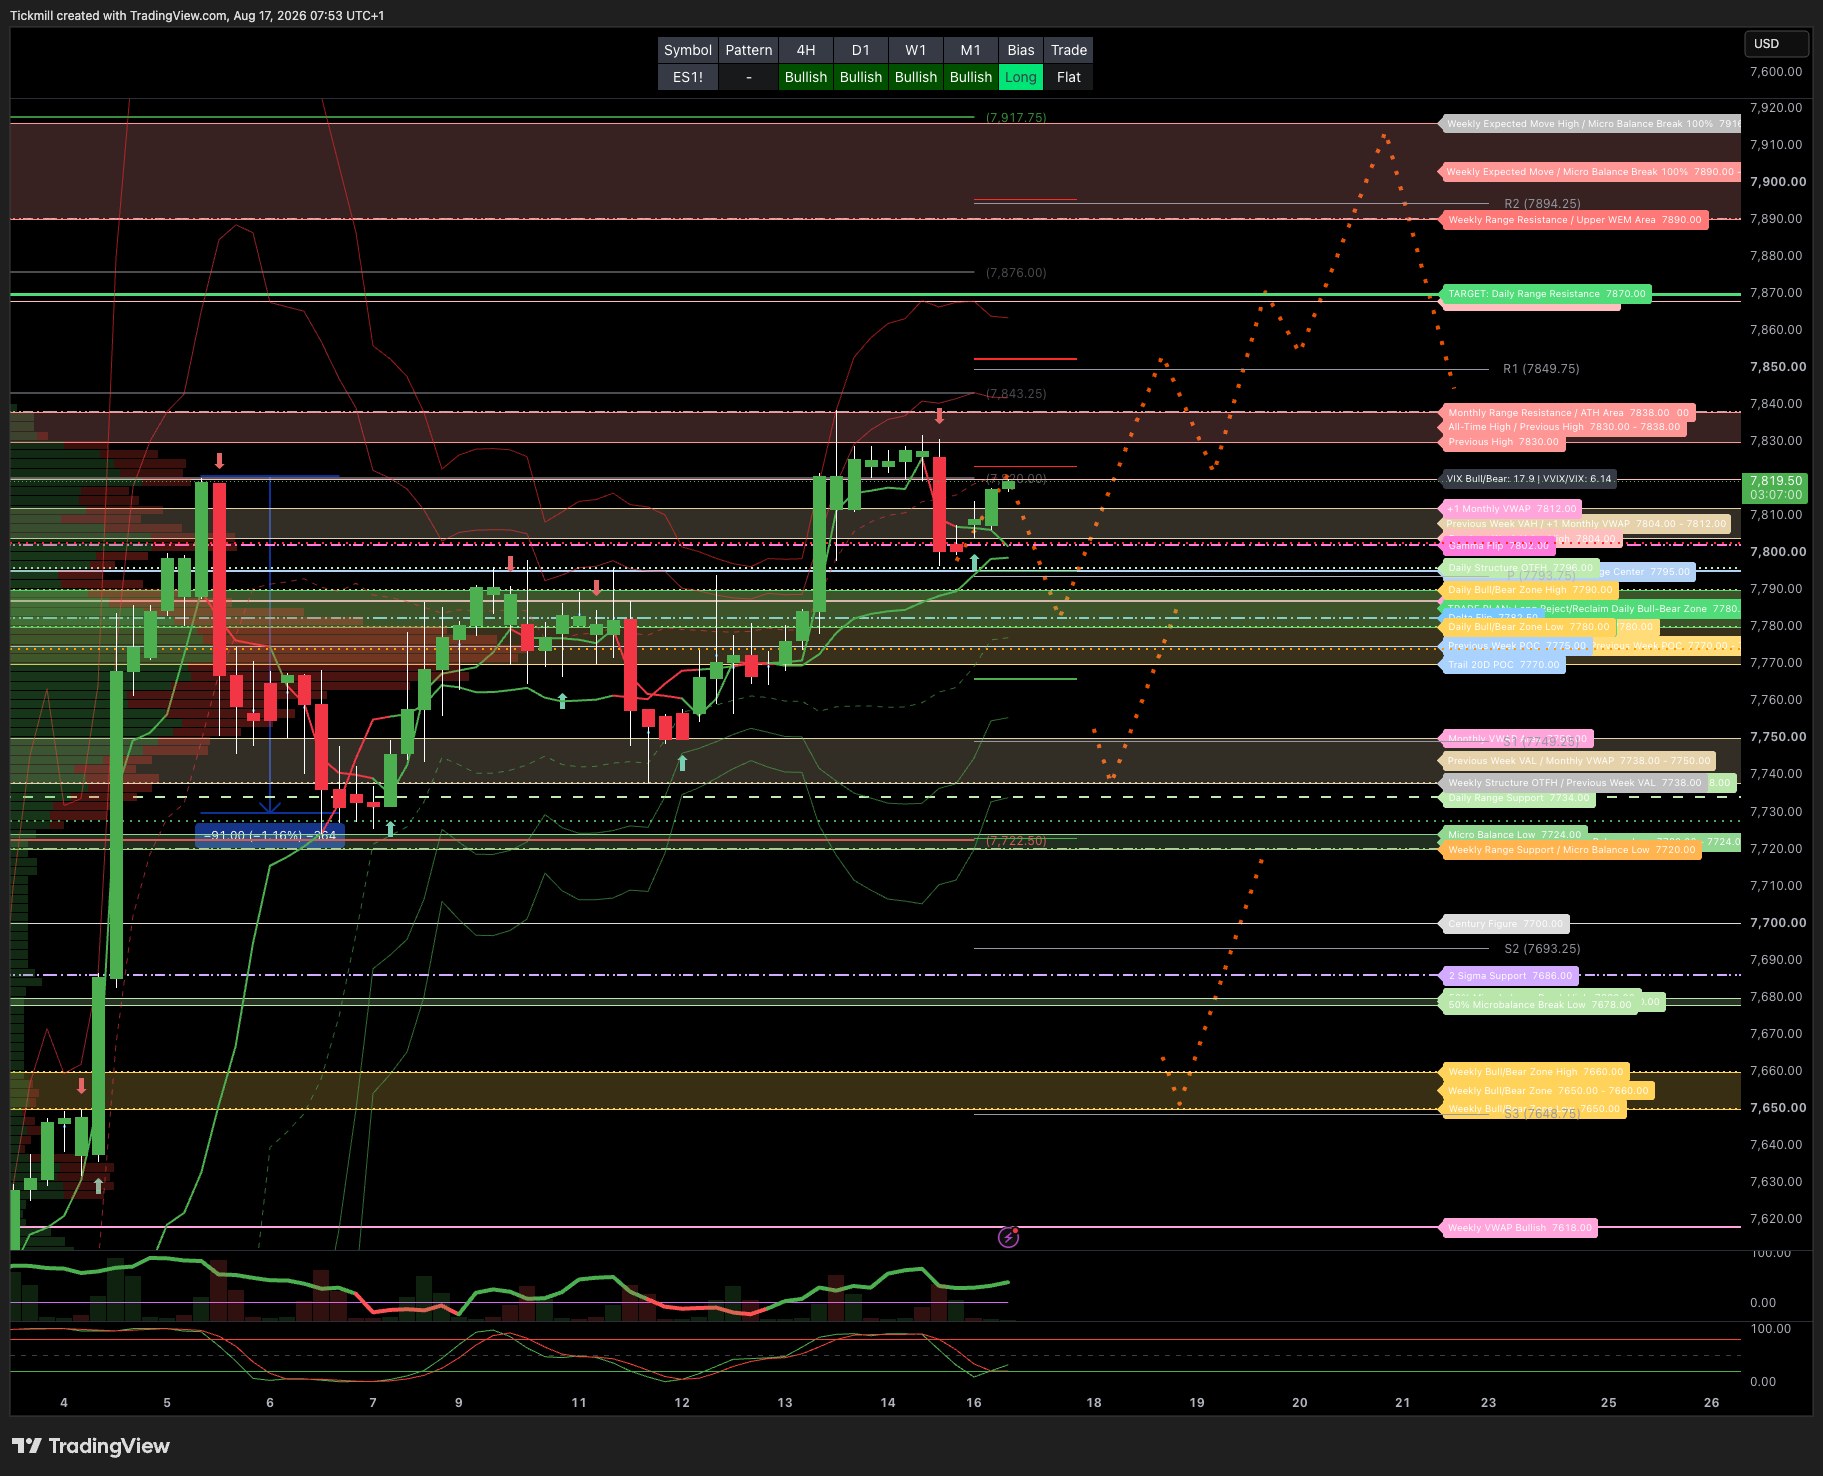
S&P500 Daily Action Areas & Price Targets 17/8/26
***QUOTING ES1! FOR CASH US500 EQUIVALENT LEVELS, SUBTRACT POINT DIFFERENCE***
SPX PUT/CALL RATIO 1.13 (The numbers reflect options traded during the current session.) A put-call ratio below 0.7 is generally considered bullish, and a put-call ratio above 1.0 is generally considered bearish.
GS Flow Desk: large S&P 31Aug 7000/7950 strangle in roughly $20mm vega / $115mm premium …My Read – classic “big convexity versus carry” trade: either someone paid a lot to own a wide August move, or someone got paid a lot to bet that the S&P stays comfortably inside the 7000–7950 corridor
JHEQX Q3 Collar Short Call Cap: ~7,750 – 7,900 - Long Put Strike: ~7,050 – 7,100 (approx. 5% downside protection) Short Put Strike: ~5,950
DEC2025 OPEX to DEC2026 OPEX is 945 points giving us a range of [5889,7779]
WEEKLY BULL BEAR ZONE 7660/50
WEEKLY RANGE RES 7890 SUP 7720
MONTHLY RANGE RES 7838 SUP 7258
DAILY VWAP BULLISH 7787
WEEKLY VWAP BULLISH 7618
MONTHLY VWAP BULLISH 7503
DAILY STRUCTURE - OTFH - 7796
WEEKLY STRUCTURE - OTFH - 7738
MONTHLY STRUCTURE - OTFH - 7345.75
Balance: This refers to a market condition where prices move within a defined range, reflecting uncertainty as participants await further market-generated information. Our approach to balance includes favouring fade trades at the range extremes (highs/lows) while preparing for potential breakout scenarios if the balance shifts.
One-Time Framing Higher (OTFH): This represents a market trend where each successive bar forms a higher low, signalling a strong and consistent upward movement.
One-Time Framing Lower (OTFL): This describes a market trend where each successive bar forms a lower high, indicating a pronounced and steady downward movement.
DAILY BULL BEAR ZONE 7790/80
GAMMA FLIP 7802
DELTA FLIP 7782.5
DAILY RANGE RES 7870 SUP 7734
2 SIGMA RES 7938 SUP 7686
VIX BULL BEAR ZONE 17.9 (VVIX / VIX) 6.14
TRADES & TARGETS
LONG ON REJECT/RECLAIM DAILY BULL BEAR ZONE TARGET DAILY RANGE RES
***ADDITIONAL SETUPS & TARGETS HIGHLIGHTED ON THE CHARTS***
(I FADE TESTS OF 2 SIGMA LEVELS ESPECIALLY INTO THE FINAL HOUR OF THE NY CASH SESSION AS 90% OF THE TIME WHEN TESTED THE MARKET WILL CLOSE ABOVE OR BELOW THESE LEVELS)
GOLDMAN SACHS FICC & EQUITY TRADING DESK VIEWS
Global Earnings Broadening vs. Underpriced Risk Factors
Constructive Fundamentals, But Markets May Be Too Relaxed on Rates, Funding, Oil, and China Policy
The incremental data continue to support the “broadening earnings” thesis, not just in the US but globally. Even areas that have lagged in price action — notably Software, Europe, and India — are showing more resilient earnings than the market is giving them credit for.
But the risk section matters. The market has moved quickly toward a benign Fed / soft-landing / earnings-broadening narrative, while several pain points remain unresolved:
Fed pricing has repriced dovishly.
Long-end yields continue to rise.
AI-linked credit is widening versus non-AI.
Hyperscaler debt issuance could be very large.
Oil risk is more about refined products than crude alone.
Leveraged ETF positioning is off highs but still elevated.
China POE policy tone has moved back into slightly restrictive territory.
So the clean synthesis is:
Global earnings breadth is improving, but the macro-financing backdrop is becoming more fragile. That argues for continued equity upside where revisions are rising, but with greater selectivity and more attention to rates, credit spreads, and oil.
1. Software: Topline Still Resilient, But Stocks Lag
The important point on Software is that fundamentals are not breaking.
Even Software stocks are still delivering resilient topline growth.
That matters because Software has been under pressure from:
duration sensitivity
AI disruption fears
weaker seat-based growth
lower net retention
consolidation of enterprise budgets
migration of spend toward infrastructure / compute
valuation compression
But the topline picture suggests the sector is not collapsing.
The issue is more about:
Resilient Revenue Growth≠Stock OutperformanceResilient Revenue Growth=Stock Outperformance
Why performance continues to lag:
investor preference for AI infrastructure over applications
uncertainty around AI monetization in software
pressure on pricing / seats from AI agents
still-elevated multiples in parts of the group
margin reinvestment requirements
lower tolerance for “in-line” guidance
lower scarcity value versus semis / hardware / power
Software may stabilize, but it likely needs one of three catalysts to lead:
clear AI monetization evidence
reacceleration in net new ARR / RPO
lower real yields
Until then, resilient growth may only be enough for relative stabilization, not leadership.
2. Europe: Surprisingly Resilient Earnings
Europe’s performance continues to surprise positively.
Key earnings data:
1H EPS +14% YoY
strongest pace in 3 years
expected 2H acceleration
full-year EPS expected around +15%
That is notable because Europe has lacked the obvious AI tailwind of the US and has faced meaningful headwinds:
TTF gas has doubled this year
weaker structural growth
tariff uncertainty
geopolitics
China demand uncertainty
political fragmentation
Despite that, earnings are holding up.
Possible drivers:
financials strength
defense spending
industrial exports
global cyclicals exposure
cost discipline
weaker currency benefits in some exporters
shareholder returns
lower starting valuations
better-than-feared macro
This supports the idea that broadening is global, not just US ex-Mag7.
3. Europe 2027 Revisions Are Moving Up
The point that 2027 earnings are being revised up is important because it says the rally is not just backward-looking.
Markets can absorb high index levels if forward earnings are also rising.
The Europe setup becomes more credible if:
2026 Earnings Strength+2027 Upward Revisions=Valuation Support2026 Earnings Strength+2027 Upward Revisions=Valuation Support
This is especially powerful in a market that started from cheaper multiples than the US.
The key constraint remains rates and energy.
If long-end yields continue rising or gas prices remain elevated, Europe’s valuation re-rating may be capped even if earnings improve.
4. Asia: Earnings Revisions Up Sharply
Asia earnings have been revised up:
+10% over the past three months
The ERLI signal points to:
further upgrades
but at a moderating pace
Leadership is concentrated in:
Korea
Taiwan
hardware tech
industrials
That maps directly onto the AI infrastructure / semiconductor cycle.
This is consistent with flow commentary that China ADR weakness may reflect source-of-funds rotation into:
Korea
Taiwan
Japan
Asia’s strongest earnings momentum is in the AI supply chain, not broad China domestic demand.
5. Memory Cycle: Higher-for-Longer Still Intact
You remain believers in a higher-for-longer memory cycle, and the regional earnings data support that.
The memory cycle has several tailwinds:
AI server demand
HBM intensity
GPU attach rates
advanced packaging constraints
data-center buildout
rising DRAM content
disciplined supply from major producers
longer lead times
improving pricing
hardware-tech earnings upgrades in Korea / Taiwan
The key point:
The AI infrastructure cycle is not just about GPUs. It is also about memory, networking, power, packaging, and storage.
A higher-for-longer memory cycle benefits:
Korea
Taiwan
Japan equipment / materials
select US semiconductor supply chain
industrials tied to data-center hardware
Risk to the thesis:
hyperscaler capex slowdown
China substitution
inventory overbuild
excessive capacity response
HBM pricing normalization
AI ROI skepticism
But for now, revisions support the bull case.
6. India: Earnings Improve, But Market Lags
India ex-commodities earnings growth has picked up to the:
mid-teens
first time in 6 quarters
That is a meaningful fundamental improvement.
Yet NIFTY is still:
-7% YTD
making it the second-worst performing market after:
JCI at -26%
This creates a potential valuation / positioning debate.
Reasons India may have lagged despite improving earnings:
high starting valuation
foreign outflows
rotation into Korea / Taiwan / Japan
weaker INR sensitivity
policy / election concerns
slower consumption in pockets
preference for AI hardware exposure elsewhere
crowded ownership at the start of the year
India may become more interesting if earnings upgrades continue while price performance remains weak.
But the hurdle is valuation.
India tends to require either:
sustained domestic inflows
accelerating earnings revisions
lower global yields
or improved foreign appetite
to outperform.
7. Risk Factor 1: Fed Pricing May Be Too Relaxed
Market pricing for a September hike has moderated sharply:
roughly 30% now
versus roughly 70% at the start of August
GS maintains the view that inflation will stay benign enough to keep the Fed on hold in September.
But the margin for error is thin.
Why?
the Committee is divided
inflation is lower but not dead
core PCE tracking remains above target
oil / refined product pressures remain a risk
long-end yields are rising
labor data are not weak enough to force easing
financial conditions have loosened with equities higher
This creates asymmetric risk:
Market Prices Fed Hold⇒Hot Data Has Bigger Negative ImpactMarket Prices Fed Hold⇒Hot Data Has Bigger Negative Impact
The market has reduced the hike probability, so a hawkish data surprise can reprice rates quickly.
8. Risk Factor 2: Long-End Yields Keep Rising
Longer-dated yields remain a major risk.
The US 30-year auction reportedly produced the highest print since 2001.
That matters because the equity market can tolerate some Fed-on-hold repricing, but persistent long-end pressure is more dangerous.
Drivers of long-end yield upside:
large fiscal deficits
Treasury supply
term premium
inflation uncertainty
corporate issuance
AI-related debt
hyperscaler bonds
real neutral rate repricing
foreign demand uncertainty
This is the heart of the rates disconnect discussed earlier.
Even if the Fed stays on hold:
Long-End Yields↑⇒Equity Multiples↓Long-End Yields↑⇒Equity Multiples↓
So the risk is not just Fed hikes.
It is the entire duration supply / real yield complex.
9. Risk Factor 3: AI Credit Spreads Are Widening
AI-related IG spreads are now:
25bps wider than non-AI counterparts
That is a warning signal.
Earlier in the cycle, AI exposure was viewed almost entirely as a positive. Wider spreads suggest credit investors are beginning to price risks around:
capex intensity
funding needs
uncertain ROIC
customer concentration
vendor financing
debt-funded infrastructure
technology obsolescence
power / utility constraints
asset duration mismatch
This does not mean the AI capex cycle is breaking.
But it does mean equity investors should stop assuming credit markets are fully validating the theme.
A key point:
Equities may still reward AI capex, while credit starts demanding more compensation for funding it.
That divergence is important.
10. Risk Factor 4: Hyperscaler Debt Supply
Potential additional IG debt issuance from hyperscaler capex alone:
around US$400bn
This is a large amount of high-grade duration supply.
The issue is not default risk. The hyperscalers have access to capital.
The issue is absorption and pricing.
Potential consequences:
wider IG spreads
higher term premium
higher corporate borrowing costs
crowding out of lower-quality issuers
pressure on levered data-center operators
more scrutiny of AI ROI
upward pressure on real yields
This links the AI theme directly to the bond market.
The equity bull case depends on whether the market continues to accept:
More AI Debt→More AI Capex→More Future EarningsMore AI Debt→More AI Capex→More Future Earnings
If investors start worrying instead about:
More AI Debt→Lower ROE / Lower FCF→Multiple CompressionMore AI Debt→Lower ROE / Lower FCF→Multiple Compression
then AI leadership becomes more volatile.
11. Risk Factor 5: ROE Question
Funding is one issue. ROE is another.
Even if hyperscalers can borrow, the market still needs proof that incremental capex earns attractive returns.
The question is:
Does AI capex generate enough incremental revenue, margin, and retention to justify the capital intensity?
Key metrics to watch:
cloud revenue growth
AI-specific cloud backlog
utilization rates
inference margins
depreciation schedules
capex-to-revenue ratios
FCF conversion
ROIC / ROE commentary
customer concentration
pricing power
GPU useful lives
The equity market recently rewarded MSFT and AMZN for drawing a clearer link between AI capex and ROIC.
That link must persist.
12. Risk Factor 6: Geopolitics and Oil
Geopolitical risks remain live:
US-Iran / Hormuz
Russia
tariffs
China policy
export controls
Oil is a key transmission channel, but the note correctly highlights that the bigger pain point may not be crude alone.
The real pressure is in:
downstream refined products
Refined products matter directly for CPI through:
gasoline
diesel
jet fuel
transportation costs
logistics
airfare
consumer inflation expectations
Even if crude is rangebound, refinery constraints can tighten product spreads and keep consumer-facing energy inflation sticky.
The inflation risk is therefore:
Refined Product Tightness→Higher Headline CPI→Fed RepricingRefined Product Tightness→Higher Headline CPI→Fed Repricing
This matters because the market has already repriced September hike odds down.
13. Risk Factor 7: Leveraged ETF Positioning
Leveraged ETF positions in:
US Tech
Korea / Taiwan
have declined meaningfully from highs, but remain elevated versus longer-term history.
This is another “less bad, not clean” positioning signal.
Like hedge-fund exposure:
not as stretched as before
but still not washed out
still vulnerable if momentum turns
still exposed to vol-targeting / leverage reduction dynamics
This matters for AI / semis / Asia hardware because retail and levered products can amplify moves both ways.
If the AI trade resumes higher, leverage can re-enter.
If it breaks lower, de-risking can accelerate.
14. Risk Factor 8: China Policy Toward POEs Back to Slightly Restrictive
The China policy proxy indicates policy toward private-owned enterprises is back in a:
slightly restrictive zone
That is a headwind for China equities and ADRs.
It fits recent weakness in China ADRs and the rotation into:
Korea
Taiwan
Japan
China remains difficult because investors face:
policy uncertainty
deflation pressure
weak confidence
property drag
POE regulation risk
tariff / geopolitical overhang
AI chip restrictions
lower visibility on earnings
This makes China less attractive relative to Asia AI supply-chain markets unless policy turns decisively supportive.
15. The Global Equity Map
Most Constructive
US Large-Cap / S&P
Supported by:
earnings breadth
Tech still working
Fed hike odds lower
positioning reset
buybacks
AI capex
Korea / Taiwan
Supported by:
earnings upgrades
memory cycle
AI hardware
industrials
semis
Japan
Supported by:
earnings
buybacks
governance reform
shareholder returns
Europe
Supported by:
resilient EPS
upward revisions
valuation
financials / industrials
More Mixed
Software
Resilient topline, but needs AI monetization or lower yields to outperform.
India
Earnings improving, but valuation and YTD underperformance complicate timing.
Small Caps
Already rerated; drivers may fade unless yields decline.
China
Policy and macro uncertainty remain meaningful headwinds.
16. Market Implication: Earnings Say “Buy Dips,” Risks Say “Use Hedges”
The earnings picture argues against a bear market.
But the risk picture argues against complacency.
The right conclusion is not to abandon equities.
It is to be more selective and use risk management.
Constructive positioning:
S&P upside in August
quality cyclicals
AI infrastructure leaders
memory cycle beneficiaries
Japan
select Europe
gold
defined-risk QQQ upside
avoid weakest AI financing chains
Risk management:
watch long-end yields
watch IG AI spreads
watch refined product spreads
watch Fed pricing
watch China POE policy tone
avoid crowded levered ETF expressions
consider hedges into September / October
17. How This Fits the August / Sept-Oct / Year-End Roadmap
This update reinforces the roadmap:
August
Earnings breadth and benign CPI support continued upside.
September / October
Risks become more important:
supply
seasonals
Fed uncertainty
long-end yields
AI debt issuance
oil / refined products
geopolitics
midterm headlines
China policy
Year-End
If those risks create chop but not earnings damage, the setup improves for a year-end push.
The path remains:
August Higher→Sept/Oct Choppy→Year-End PushAugust Higher→Sept/Oct Choppy→Year-End Push
Global earnings breadth continues to improve. Even Software is delivering resilient topline growth despite lagging stock performance. Europe’s 1H EPS growth tracked +14% YoY, the strongest in three years, with 2H acceleration expected to bring full-year growth to +15%. Asia earnings have been revised up 10% over the past three months, led by Korea, Taiwan, hardware tech, and industrials, supporting the higher-for-longer memory cycle. India ex-commodities earnings growth has improved to the mid-teens for the first time in six quarters, though NIFTY remains down 7% YTD.
The risk is that markets may not be paying enough attention to pain points. September Fed hike pricing has fallen to around 30% from 70% at the start of August, leaving a thin margin for error. Long-end yields continue to rise, with fiscal deficits and AI-related corporate financing needs creating upside risk. AI-related IG spreads are now 25bps wider than non-AI peers, and hyperscaler capex could drive roughly US$400bn of additional IG debt issuance. Geopolitics, refined-product tightness, still-elevated leveraged ETF exposure, and a slightly restrictive China POE policy backdrop all argue for more volatility into September / October.
Disclaimer: The material provided is for information purposes only and should not be considered as investment advice. The views, information, or opinions expressed in the text belong solely to the author, and not to the author’s employer, organization, committee or other group or individual or company.
Past performance is not indicative of future results.
High Risk Warning: CFDs are complex instruments and come with a high risk of losing money rapidly due to leverage. 69% and 73% of retail investor accounts lose money when trading CFDs with Tickmill UK Ltd and Tickmill Europe Ltd respectively. You should consider whether you understand how CFDs work and whether you can afford to take the high risk of losing your money.
Futures and Options: Trading futures and options on margin carries a high degree of risk and may result in losses exceeding your initial investment. These products are not suitable for all investors. Ensure you fully understand the risks and take appropriate care to manage your risk.
Patrick has been involved in the financial markets for well over a decade as a self-educated professional trader and money manager. Flitting between the roles of market commentator, analyst and mentor, Patrick has improved the technical skills and psychological stance of literally hundreds of traders – coaching them to become savvy market operators!