SP500 LDN TRADING UPDATE 5/3/26

SP500 LDN TRADING UPDATE 5/3/26
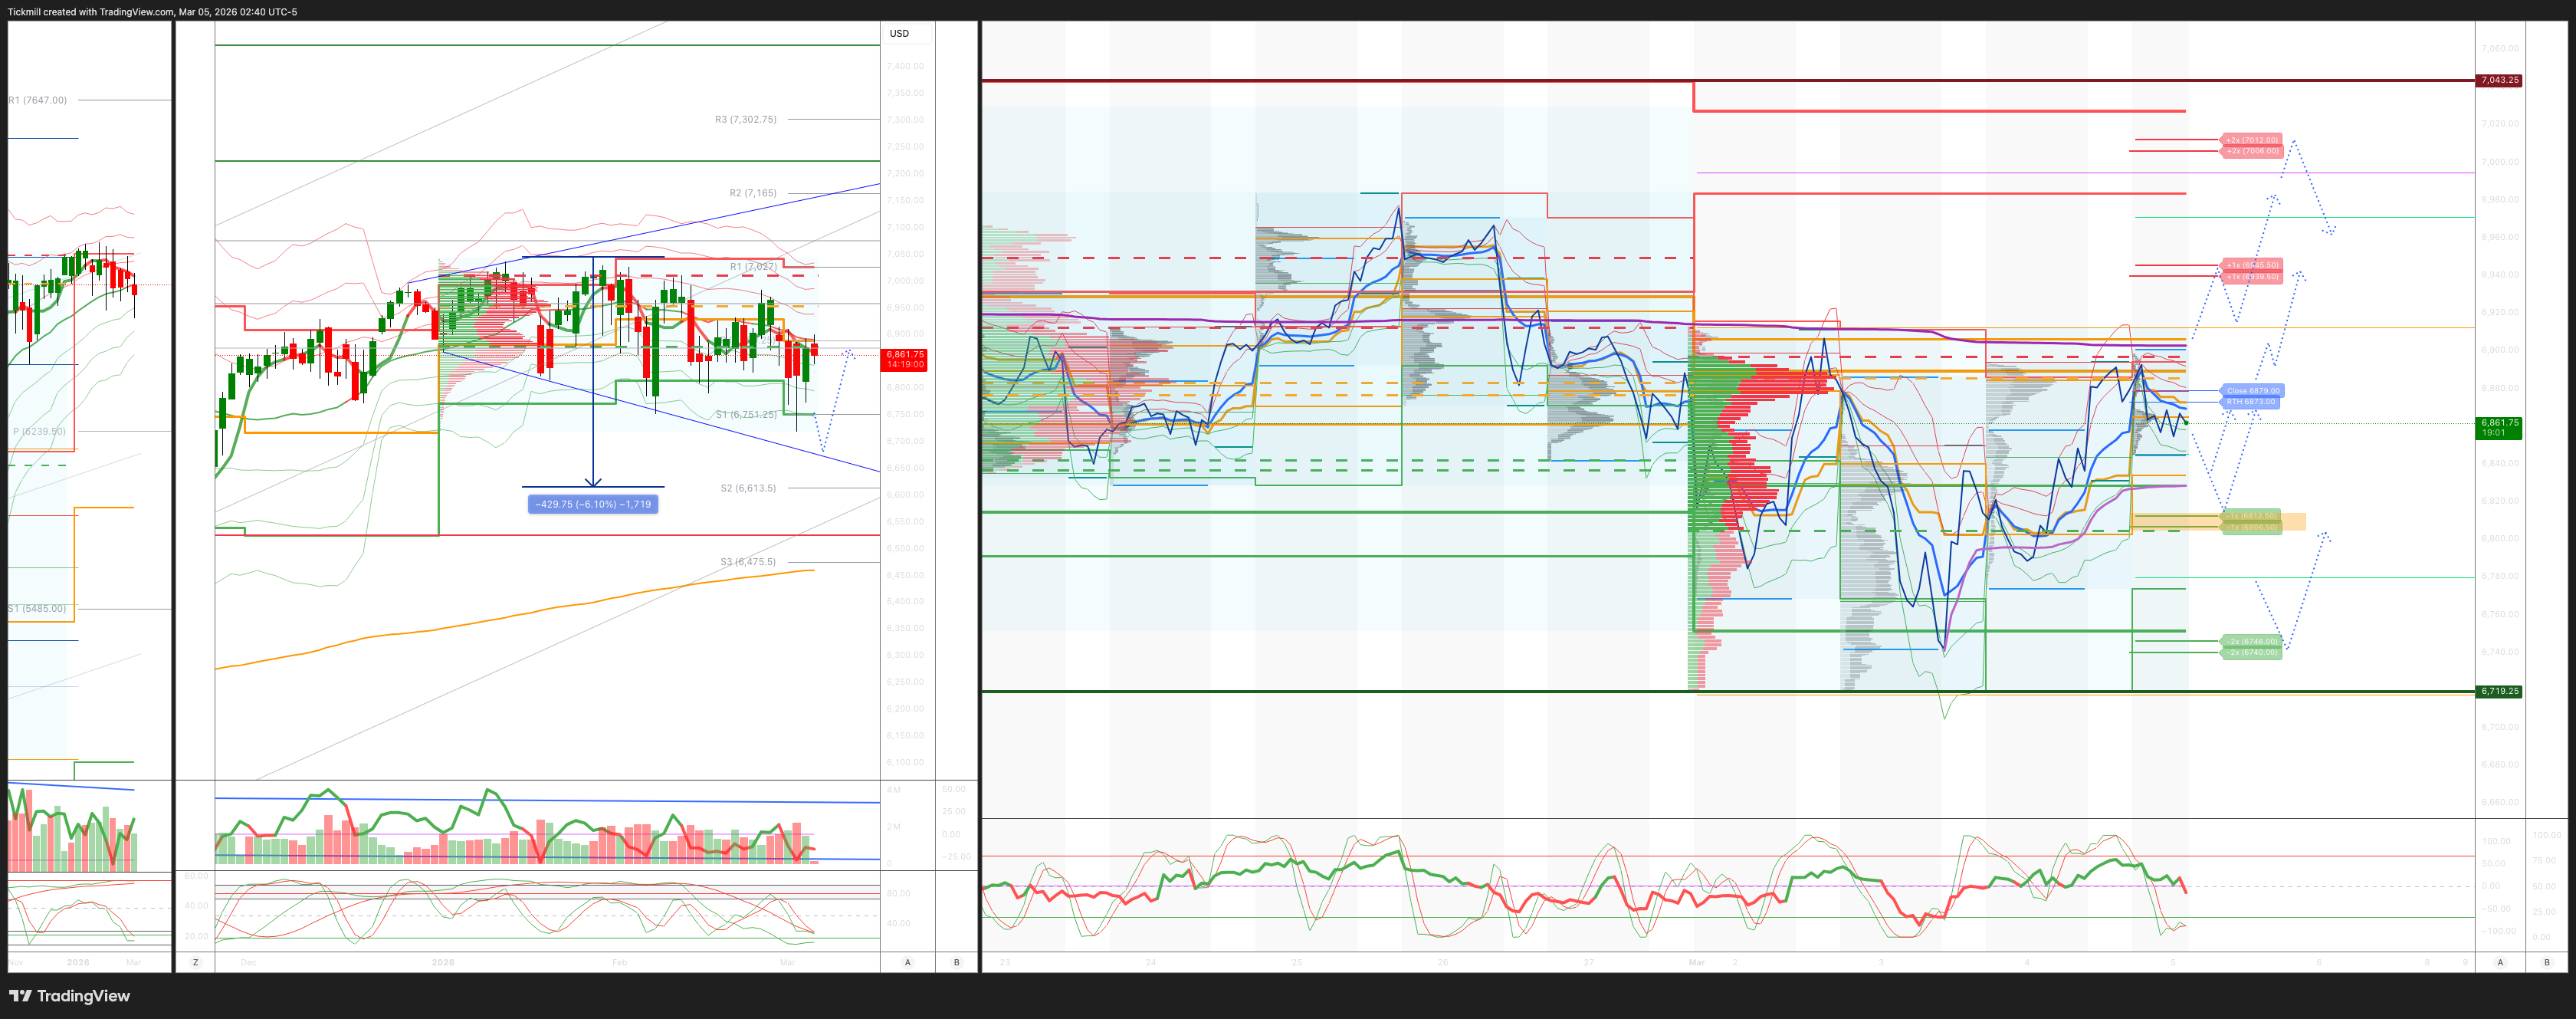
WEEKLY & DAILY LEVELS
***QUOTING ES1! FOR CASH US500 EQUIVALENT LEVELS, SUBTRACT POINT DIFFERENCE***
WEEKLY BULL BEAR ZONE 6940/50
WEEKLY RANGE RES 7031 SUP 6745
Weekly Straddle Range: 143 -point straddle implies a weekly range of [6745, 7031]; monitor 1.5x and 2x moves for key reactions.
March OPEX Straddle: 232.8-point range suggests OPEX-to-OPEX movement between [6677, 7142].
March QOPEX Straddle: 368.55-point range projects [6466, 7203], based on December OPEX.
March EOM Straddle: 255.4-point straddle indicates a monthly range of [6623, 7101]. .
DEC2025 to DEC2026 OPEX straddle spans 945 points, outlining a range of [5889, 7779]."
DAILY VWAP BEARISH 6865
WEEKLY VWAP BEARISH 6917
MONTHLY VWAP BEARISH 6893
DAILY STRUCTURE – BALANCE - 6911/6718
WEEKLY STRUCTURE – OTFD
MONTHLY STRUCTURE - OTFD
Balance: This refers to a market condition where prices move within a defined range, reflecting uncertainty as participants await further market-generated information. Our approach to balance includes favouring fade trades at the range extremes (highs/lows) while preparing for potential breakout scenarios if the balance shifts.
One-Time Framing Higher (OTFH): This represents a market trend where each successive bar forms a higher low, signalling a strong and consistent upward movement.
One-Time Framing Lower (OTFD): This describes a market trend where each successive bar forms a lower high, indicating a pronounced and steady downward movement.
DAILY BULL BEAR ZONE 6812/02
GAMMA FLIP 6872
DAILY RANGE RES 6939 SUP 6806
2 SIGMA RES 7006 SUP 6740
VIX BULL BEAR ZONE 20
PUT/CALL RATIO 1.25 (The numbers reflect options traded during the current session. A put-call ratio below 0.7 is generally considered bullish, and a put-call ratio above 1.0 is generally considered bearish)
TRADES & TARGETS
LONG ON REJECT/RECLAIM OF DAILY BULL BEAR ZONE TARGET RTH CLOSE
(I FADE TESTS OF 2 SIGMA LEVELS ESPECIALLY INTO THE FINAL HOUR OF THE NY CASH SESSION AS 90% OF THE TIME WHEN TESTED THE MARKET WILL CLOSE ABOVE OR BELOW THESE LEVELS)
JPMORGAN TRADING DESK VIEW -
JPM MARKET INTEL — EQUITY & MACRO NARRATIVE
POSITIONING INTELLIGENCE – Tactical Takes | TPM Triggers “Attractive” Set-Up for US Stocks… HFs BTD Early This Week in US
SUMMARY OF US FLOWS AND POSITIONING: While markets have been volatile, the intraday bounces in US stocks have coincided with buying by HFs (+1z on Mon and Tues), most of which has come from longs added though shorts were also covered on Tues. This follows a period of selling that started in late 2025 and strong de-grossing in 1H Feb. In a similar vein, US Retail investors have been buyers (based on JPM QDS updates) though mostly via ETFs. Broader US ETF flows (i.e. not just retail) suggests outflows over the past 3 days. CTA positioning dipped a little in the US early this week.
The reduction in risk over the past few weeks has caused our US Tactical Positioning Monitor to signal an “attractive” set-up (i.e., US stocks could bounce a bit). Notably, this is mostly due to changes in prior weeks as the 4wk change now sits at -1.7z on a 3d avg basis, below the -1.5z threshold, even though the 1wk change is less negative at -1.4z. Positioning levels appear to be back around where they were in late Nov ’25 with it at the 42nd %-tile since 2015.
Given the situation remains very fluid and the initial reaction in the US has been to hedge previously and then BTD tentatively in stocks over the past 2 days, it’s possible that any rebound we get in the next week or two proves fleeting if the situation worsens. There is some precedent for this in that we saw a similar shift in early Mar ’25 where the 4wk change triggered an initial attractive set-up, but then triggered it again with a much more negative change in early April. Or looking back to 2023, there was an attractive set-up in mid-late Aug ’23, but then positioning dipped again into late Oct.
In terms of HF strategies, we saw net buying over the past two days across Quants and L/S funds mainly. From a sector perspective, the buying has been broad-based with Utilities, Cap Goods, Insurance, Software and other pockets of TMT and Fins also bought.
OUTSIDE OF THE US: HFs were also buyers in EMEA on Tues, after having sold on Fri and Mon. They have generally been buyers of EMEA since mid-Dec. The buying on Tues was somewhat broad across strategies and sectors (Fins, Materials, Staples, Discretionary, Energy all bought on Tues). CTA positioning has been elevated in Europe, but we saw it start to come off in Stoxx 50 this week.
In Asia, HFs were paired off on Tues after 1z selling on Mon. They’ve generally been net selling since late 2025 and most of the selling YTD came in HK and China as Japan was bought in Feb. Japan has been very long among CTAs, given the strong performance in the region. Korea flows were starting to tilt more negatively among HFs on a YTD basis, though CTA positioning has been at historical highs there.
HF PERFORMANCE: HF performance took a dip early this month with All Strategies down 1.9% globally. The losses have been broad based across regions with L-S spreads about flat to slightly negative in most regions and strategies – i.e., some alpha pain, but not that extreme overall. Equity L/S and Multi-Strat spreads have been the worst in N. America, which has coincided with a reversal in Semis vs. Software (we wrote previously about the outsized positive Tech Alpha for these strategies that had been correlated to Semis vs. Software returns).
ISM POST-MORTEM
• JPM ECON (Abiel Reinhart) – The ISM services report, unlike its PMI counterpart, is increasingly upbeat, with a strong February report. The overall composite rose from 53.8 to 56.1, the best reading since July 2022, despite some mentions in the industry comments of a weather drag. All the sub-components rose, save supplier deliveries, and the prices paid index fell from 66.6 to 63.0, the lowest in almost a year though still well above 2024. Only three industries reported a contraction in activity. We find both the PMI and ISM surveys useful, and the combined average of their business activity measures is highest since the end of 2024.
• US MKT INTEL (IB Blast after the print) – Goldilocks print. ISM-Mfg and ISM-Srvcs point to an accelerating economy. ADP (and presumably NFP) supportive of that acceleration translating to hiring. If Retail Sales confirm that spending continues … then the only piece missing is a resolution to the US / Iran war. Here, we are tracking tanker volume via Hormuz, as that normalizes the market should put this bout of uncertainty behind us and then resume it march to/thru 7k. Look for Tech and Cyclicals to lead that charge.
o ADP number is a positive surprise and the 63k print compares to +6k being the six-month average. Today’s print was the best since July of last year. Iran war aside, the US economy has positive momentum and if hiring returns then look for growth to be materially above trend which has positive ramifications for earnings and risk assets and is supportive of the view that the Fed remains on-hold for all of 2026.
o ICYMI our Positioning team’s quant indicator flash BUY. Normally, I would be more fired up about that than the average person, but the risk remains that US / Iran escalates but ultimately we look for Hormuz tanker volume to return normalize as the all-clear signal.
TRADING DESK COMMENTARY
• JOSH MEYERS (TMT) – NVDA (2.2%) | MS Tech Conf: CEO Jensen Huang
o This is a full-stack problem. If you don't own the full stack, it's hard to innovate on an annual cadence.
o 3 AI inflection points over the past year:
1) Generative (convert from one form to another/auto-recursively generate tokens),
2) conditional generation (adding reasoning, self-reflection & -correction) and skyrocketing usefulness/much more usage (next phase of growth),
3) ability to reason and solve problems (openClaw - probably the most important release of software ever, in only 3 weeks).
Prompts are now actions.
o Amount of compute any company needs is skyrocketing. Reiterating token to revenue narrative. Compute = revenue. And NVDA's token/watt is an order of magnitude ahead of the competition. Tokens/dollar also the best - an order of magnitude cheaper.
o You either build because you believe software is important; but also because you believe there's no software in the future that's not agentic. In the future software companies rent tools, but also the experts to use them: their agents are going to be extremely good at using their specialized tools. Companies like CDNS are going to be much larger - business profile will change.
o The revenue opportunity is so great, and everything is constrained. CEOs have to choose carefully. It's fantastic for NVDA.
o There is nothing about our architecture that is compatible with somebody else's. And ... our balance sheet is incredibly valuable because it provides security for our customers. Investing $30b in OpenAI ($100b investment no longer in the cards because they're going to go public). The $10b investment in Anthropic also likely the last.
o OpenAI (AWS), Anthropic (AWS/Azure) & MSL (net add on top of META) - all adding to already high growth vector.
o Reiterating that compute drives revenue, and we're at the beginning of that cycle.
• WILL GRIER (Equity Derivatives) – If you subscribe to credit spreads being good indicator of market volatility (which I do) – would highlight that CDX.IG spreads are ~2bps tighter vs. Friday’s close (and cash spreads are ~6bps tighter). Credit index desk prefers LQD put spreads or linear hedges in CDX.IG vs. options at moment given CDX.IG vols are very elevated.
o Could help explain the total lack of panic on equity vol desk last 2 days (primary flow in index y'day was hedge monetization + vol arbs looking to fade the vol, skew and term structure moves).
o Gamma: Another tough set-up from a dealer gamma positioning point of view. Our model shows dealers short at current spot (last night's close) and the whole way down (no buffer) vs. long gamma on any rally.
Disclaimer: The material provided is for information purposes only and should not be considered as investment advice. The views, information, or opinions expressed in the text belong solely to the author, and not to the author’s employer, organization, committee or other group or individual or company.
Past performance is not indicative of future results.
High Risk Warning: CFDs are complex instruments and come with a high risk of losing money rapidly due to leverage. 69% and 73% of retail investor accounts lose money when trading CFDs with Tickmill UK Ltd and Tickmill Europe Ltd respectively. You should consider whether you understand how CFDs work and whether you can afford to take the high risk of losing your money.
Futures and Options: Trading futures and options on margin carries a high degree of risk and may result in losses exceeding your initial investment. These products are not suitable for all investors. Ensure you fully understand the risks and take appropriate care to manage your risk.
Patrick has been involved in the financial markets for well over a decade as a self-educated professional trader and money manager. Flitting between the roles of market commentator, analyst and mentor, Patrick has improved the technical skills and psychological stance of literally hundreds of traders – coaching them to become savvy market operators!