S&P500 Trading Update 2/4/26

S&P500 Trading Update 2/4/26
***QUOTING ES1! FOR CASH US500 EQUIVALENT LEVELS, SUBTRACT POINT DIFFERENCE***
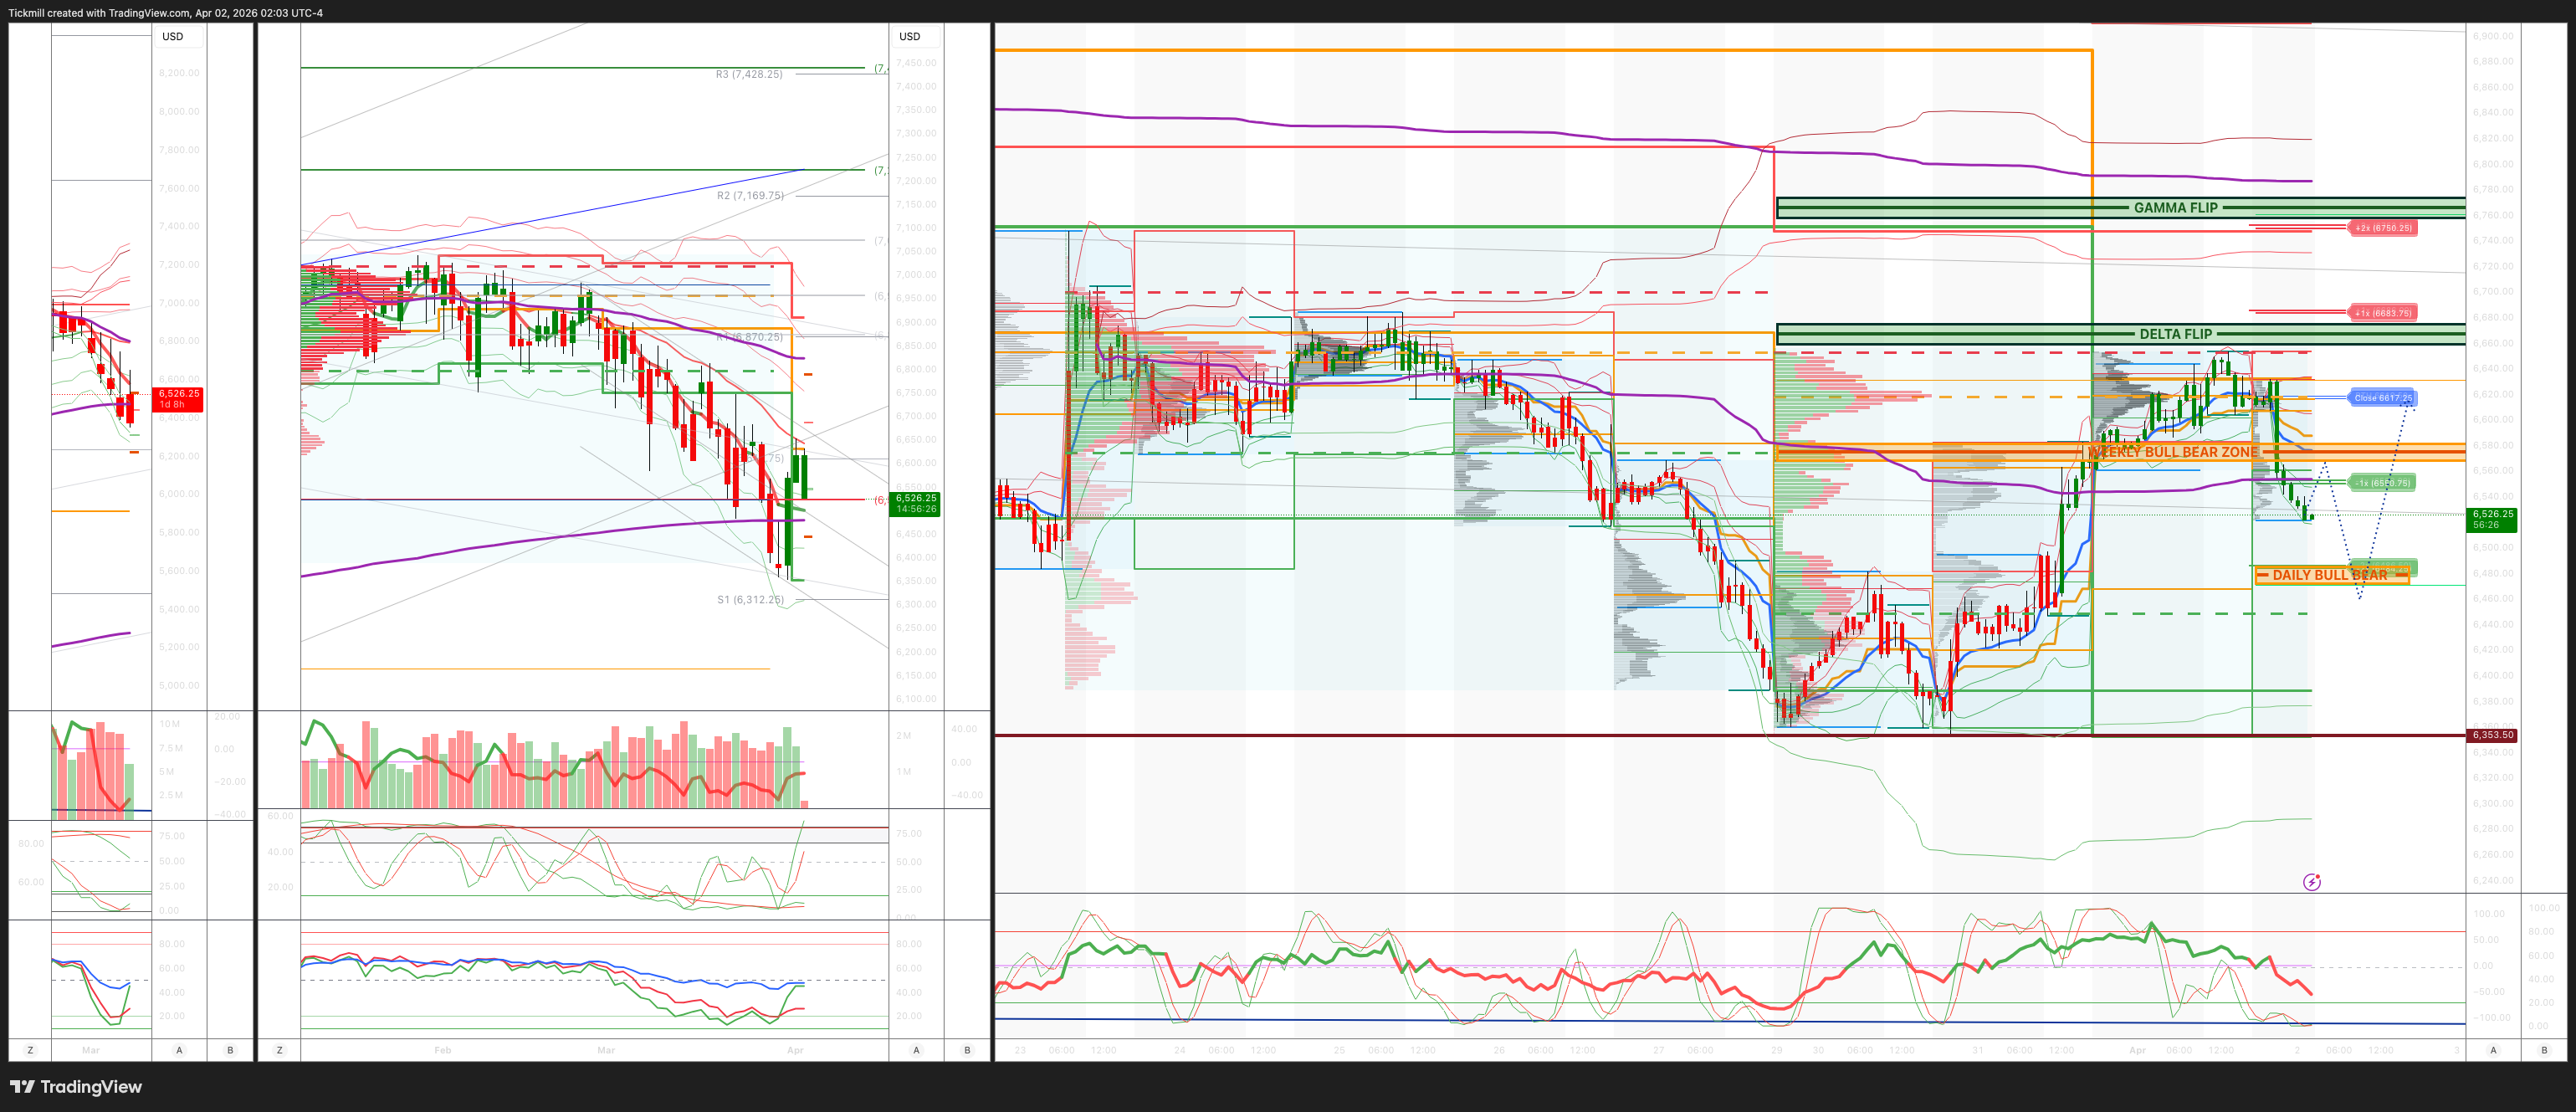
WEEKLY BULL BEAR ZONE 6570/80
WEEKLY RANGE RES 6529 SUP 6267
April OPEX Straddle: 328.55pt range implies a OPEX to OPEX range of [6177, 6835]
June QOPEX Straddle is 546.4pt giving us a range of [5960,7052]
JHEQX Q2 Collar 6189/6290 - 6865/6955
DEC2025 OPEX to DEC2026 OPEX is 945 points giving us a range of [5889,7779]
PUT/CALL RATIO 1.32 (The numbers reflect options traded during the current session. A put-call ratio below 0.7 is generally considered bullish, and a put-call ratio above 1.0 is generally considered bearish)
DAILY VWAP BULLISH 6503
WEEKLY VWAP BEARISH 6589
MONTHLY VWAP BEARISH 6816
DAILY STRUCTURE – OTFD - 6598
WEEKLY STRUCTURE – OTFD - 6704
MONTHLY STRUCTURE - OTFD - 6911
Balance: This refers to a market condition where prices move within a defined range, reflecting uncertainty as participants await further market-generated information. Our approach to balance includes favouring fade trades at the range extremes (highs/lows) while preparing for potential breakout scenarios if the balance shifts.
One-Time Framing Higher (OTFH): This represents a market trend where each successive bar forms a higher low, signalling a strong and consistent upward movement.
One-Time Framing Lower (OTFD): This describes a market trend where each successive bar forms a lower high, indicating a pronounced and steady downward movement.
DAILY BULL BEAR ZONE 6530/20
DELTA FLIP 6669
DAILY RANGE RES 6683 SUP 6550
2 SIGMA RES 6750 SUP 6484
VIX BULL BEAR ZONE 22
TRADES & TARGETS
LONG ON REJECT/RECLAIM OF DAILY BULL BEAR ZONE TARGET DAILY RANGE RES
(I FADE TESTS OF 2 SIGMA LEVELS ESPECIALLY INTO THE FINAL HOUR OF THE NY CASH SESSION AS 90% OF THE TIME WHEN TESTED THE MARKET WILL CLOSE ABOVE OR BELOW THESE LEVELS)
GOLDMAN SACHS TRADING DESK VIEW - **NOTE PRE TRUMP SPEECH
S&P rose +72bps, closing at 6,575 with a Market-On-Close (MOC) imbalance of $350m to sell. NDX gained +118bps, ending at 24,020; R2K added +64bps to close at 2,512; and the Dow climbed +48bps to finish at 46,566. Total trading volume across all U.S. equity exchanges reached 18.83 billion shares, slightly below the year-to-date daily average of 18.97 billion shares. The VIX dropped -257bps to 24.60, WTI Crude fell -179bps to $99.60, while the U.S. 10-year yield edged up +1bp to 4.33%. Gold surged +212bps to 4,768, the DXY softened -35bps to 99.61, and Bitcoin dipped -15bps to $68,108.
Markets showed positive momentum amid optimism that the Middle East conflict might be nearing resolution. The S&P reclaimed its 200-day moving average at 6,642 after 10 consecutive closes below—a streak not seen since March 2025 when it recorded 32 consecutive closes under this level. Trading activity reflected a "re-grossing" sentiment, with Momentum, Memory, and Mag7 sectors leading gains. ETF activity remained elevated near historical averages, while single-stock trading was subdued as investors awaited tonight's nationwide address at 9 p.m. ET.
Financials witnessed notable dispersion, with large moves typical for the first trading session of the quarter. A potential de-escalation in the Middle East appeared to fuel re-grossing, as momentum stocks performed strongly. However, AI-related trades showed weakness, and payment stocks, previously a defensive play amid stagflation concerns tied to the conflict, saw positioning-driven declines. Payments stocks traded down ~2% on low volume (-25% for the group). Christian DeGrasse noted nerves surrounding OWL redemption concerns, with OWL down -5% at the lows, while peers fell by low single-digit percentages. Fear of impending catalysts has frozen bullish sentiment, preventing defensive action.
Floor activity scored a 5 out of 10 in terms of overall activity levels, ending +225bps to buy. Both long-only funds (LO) and hedge funds (HFs) remained frozen, resulting in a flat finish for the day. Per our prime brokerage data, the U.S. was net bought (+1.7 SDs over the one-year average), driven by short covering outpacing long selling at a 4.7-to-1 ratio. Gross leverage declined -1.2 points to 312.5% (98th percentile for the 1-year range, 100th percentile for the 5-year range), while net leverage rose +1.5 points to 70.8% (11th percentile for the 1-year range, 35th percentile for the 5-year range).
Flow dynamics remain favorable, with dealers now flat gamma following Q1 options expiration, after previously being net short over $7 billion. The unwinding of dealer short gamma positions should reduce market volatility in both directions. CTAs have flipped to buyers, currently modeled to purchase $3.65 billion in a flat market, accelerating to $12.3 billion in an upward trend. Liquidity at the top of the book is gradually improving, now at $5.75 million on the touch (+8% vs. 5-day moving average and +26% vs. 20-day moving average). A return to $10 million liquidity levels would provide greater market confidence.
In derivatives, trading began quietly in April, with little volatility movement but firm skew as markets rallied back toward the 200-day moving average. The VIX curve remains flat—an unusual dynamic that underscores uncertainty related to the ongoing geopolitical conflict in the Middle East. Implied-realized volatility has compressed significantly, making VIX 1x2 put spreads attractive for a potential volatility reset. Dealer positioning post-quarter-end reflects reduced short gamma locally, with longer upside exposure and flipping short ~1.5% lower from current levels. The desk favors outright QQQ calls given the low volatility spread relative to the S&P, with May options looking attractive to capitalize on megacap tech earnings. The implied move into tomorrow's close is estimated at ~1.09%.
Disclaimer: The material provided is for information purposes only and should not be considered as investment advice. The views, information, or opinions expressed in the text belong solely to the author, and not to the author’s employer, organization, committee or other group or individual or company.
Past performance is not indicative of future results.
High Risk Warning: CFDs are complex instruments and come with a high risk of losing money rapidly due to leverage. 71% and 74% of retail investor accounts lose money when trading CFDs with Tickmill UK Ltd and Tickmill Europe Ltd respectively. You should consider whether you understand how CFDs work and whether you can afford to take the high risk of losing your money.
Futures and Options: Trading futures and options on margin carries a high degree of risk and may result in losses exceeding your initial investment. These products are not suitable for all investors. Ensure you fully understand the risks and take appropriate care to manage your risk.
Patrick has been involved in the financial markets for well over a decade as a self-educated professional trader and money manager. Flitting between the roles of market commentator, analyst and mentor, Patrick has improved the technical skills and psychological stance of literally hundreds of traders – coaching them to become savvy market operators!