S&P500 Daily Action Areas & Price Targets 10/10/26

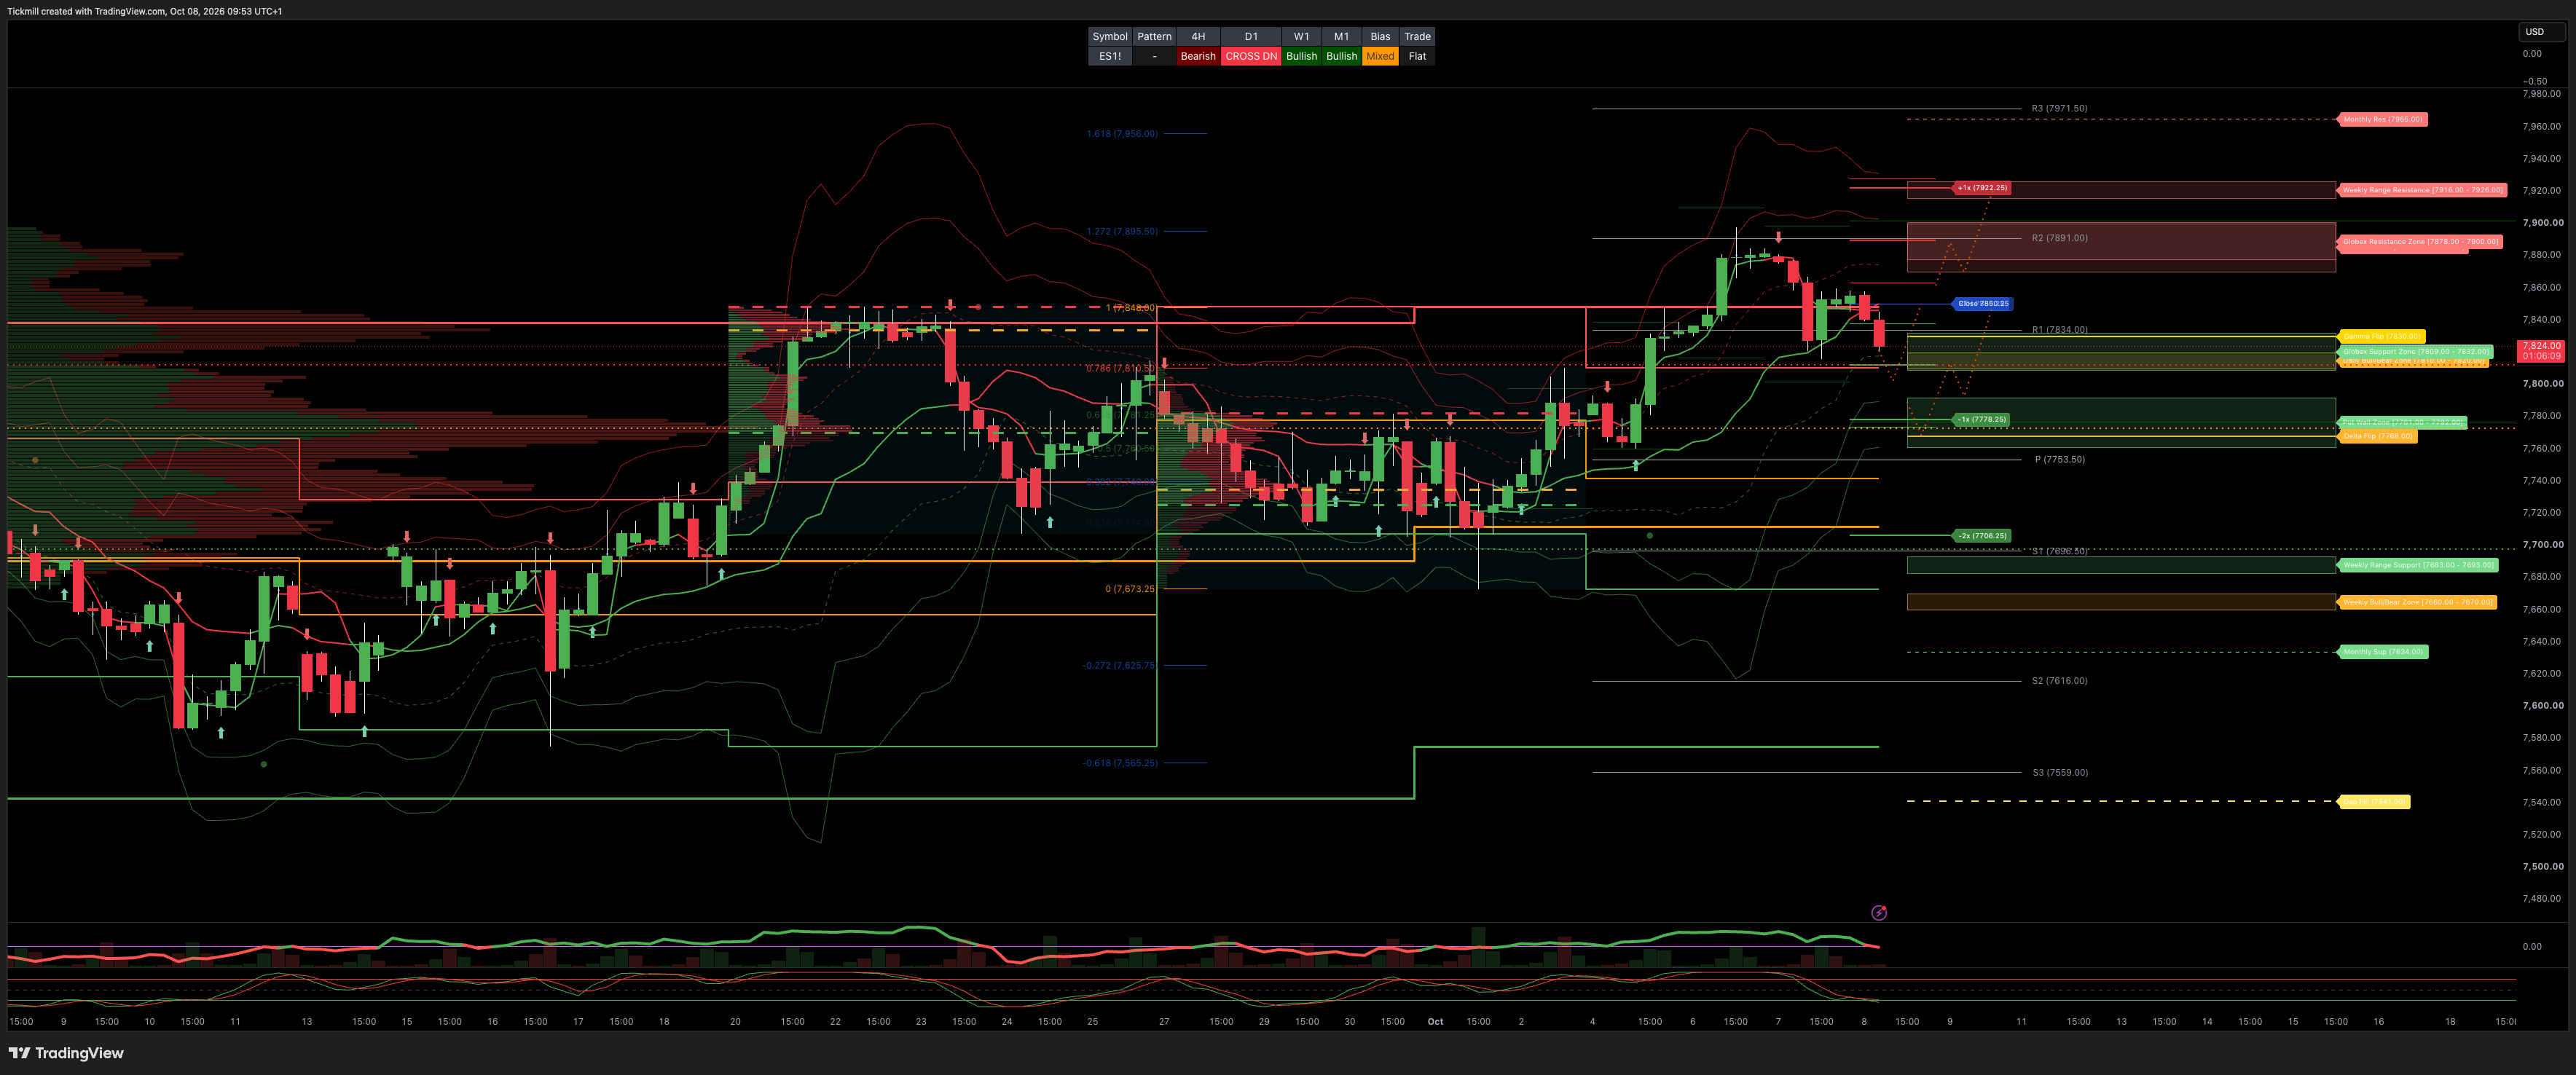
S&P500 Daily Action Areas & Price Targets 10/10/26
***QUOTING ES1!(Z CONTRACT LEVLES) FOR CASH US500 EQUIVALENT LEVELS, SUBTRACT POINT DIFFERENCE***
MONTHLY-WEEKLY& DAILY LEVELS
MONTHLY BULL BEAR ZONE 7440/7400
MONTHLY RANGE RES 7965 SUP 7634
WEEKLY BULL BEAR ZONE 7670/60
WEEKLY RANGE RES 7926/16 SUP 7683/93
DAILY BULL BEAR ZONE 7820/10
GLOBEX RANGE RES 7878/7900 SUP 7832/7809
GAMMA FLIP 7830
DELTA FLIP 7768
CALL WALLS 7870/7901
PUT WALLS 77761/92
UNFILLED GAPS 7541
DAILY STRUCTURE - BALANCE - 7897/7778
WEEKLY STRUCTURE - OTFH - TBC
MONTHLY STRUCTURE - OTFH - 7542
VIX BULL BEAR ZONE 17.7
Traders often watch the VVIX/VIX ratio, whose historical median is about 5–6; a 5.54 reading is close to normal market expectations.
PRIMARY TRADES & TARGETS
LONG ON REJECT/RECLAIM OF THE DBBZ TARGET DAILY RANGE RES > ATH’S
***ADDITIONAL SETUPS & TARGETS HIGHLIGHTED ON THE CHARTS***
(I FADE TESTS OF 2 SIGMA LEVELS ESPECIALLY INTO THE FINAL HOUR OF THE NY CASH SESSION AS 90% OF THE TIME WHEN TESTED THE MARKET WILL CLOSE ABOVE OR BELOW THESE LEVELS)
SPX PUT/CALL RATIO 1.11 (The numbers reflect options traded during the current session.) A put-call ratio below 0.7 is generally considered bullish, and a put-call ratio above 1.0 is generally considered bearish.
JHEQX Upside cap (~7,920–7,950): Dealer gamma hedging at this call strike creates resistance, with market makers likely selling futures into strength and limiting volatility. Downside cushion (~7,270): If SPX drops 5% into Q4, long put gamma may force dealers to buy futures as the index falls, helping stabilize prices. Expiration: December 31, 2026. Strong pinning effects are likely near key strikes into year-end expiration.
DEC2025 OPEX to DEC2026 OPEX is 945 points giving us a range of [5889,7779]
Notes On Structure Implications
Balance: This refers to a market condition where prices move within a defined range, reflecting uncertainty as participants await further market-generated information. Our approach to balance includes favouring fade trades at the range extremes (highs/lows) while preparing for potential breakout scenarios if the balance shifts.
One-Time Framing Higher (OTFH): This represents a market trend where each successive bar forms a higher low, signalling a strong and consistent upward movement.
One-Time Framing Lower (OTFL): This describes a market trend where each successive bar forms a lower high, indicating a pronounced and steady downward movement.
GOLDMAN SACHS FICC & EQUITY TRADING DESK VIEWS
THE TAKE: RALLY BREATHES AS SMALL CAPS & HIGH BETA TAKE THE BRUNT OF YIELD PAIN
US equities experienced a relatively muted session at the benchmark level, with the S&P 500 trading in an intraday band of just 43 bps. However, underlying sector and factor rotation was severe. Small-caps continues to bear the brunt of rising Treasury yields, with the Russell 2000 underperforming the Nasdaq-100 for a 4th consecutive session (and the 17th time across the last 20 sessions).
Market action reflected a clear flight to safety, with defensive sectors—Healthcare, Consumer Staples, and Utilities—outperforming the broader tape. Conversely, high-beta momentum themes that surged in prior sessions saw aggressive profit-taking: Rare Earths (GSXURARE -5.5%), Uranium (GSXURANI -3.5%), Robotics (GSXUROBO -3.0%), and the PowerUp America Basket (GSENEPOW -2.0%) all surrendered recent gains.
Attention turns to the FOMC Minutes, where a hawkish tone risks extending the sell-off in global bonds and applying further pressure to equities ahead of next week's Q3 bank earnings kickoff.
DESK FLOWS, PRIME BROKERAGE & FRANCHISE ACTIVITY
Goldman Sachs Prime Brokerage Recap:
US equities were net bought on the session, driven equally by long purchases and short covering. Net buying was visible across both Macro ETFs and Single Stocks.
Gross Leverage: Rose +0.6 pts to 308.4% (58th percentile 1-year, 92nd percentile 5-year lookback).
Net Leverage: Rose +0.8 pts to 78.8% (50th percentile 1-year, 78th percentile 5-year lookback).
Franchise Flow Skews & Trading Floor Sentiment:
Overall floor activity level was down -3% vs. the trailing 2-week average, with exchange volume flat vs. its 10-day moving average.
The GS execution floor tilted -9% better for sale, strongly driven by Long-Only (LO) liquidations. The Hedge Fund (HF) short ratio hit its highest level in 2 weeks.
Long-Onlys (LOs): -25% better for sale, exhibiting massive sell imbalances across Macro Products and Tech names, alongside muted demand in Staples and Industrials.
Hedge Funds (HFs): -8% better for sale. Short supply was highest in Utilities, Energy, and Industrials, paired with modest demand for Industrials.
EARNINGS PREVIEW & THEMATIC BASKET HIGHLIGHTS
Q3 Financials Earnings Kickoff: Q3 bank earnings begin next Tuesday morning with JPMorgan (JPM), Citigroup (C), and Wells Fargo (WFC) reporting. Desk focus remains on Net Interest Income (NII) trajectory, deposit beta stabilization, and capital return capacity amid steeper yield curves.
Basket Focus — Buying "Consumer Experiences" (
GSXUCEXP):The GS Baskets team highlights an attractive setup in the GS Consumer Experiences Basket (
GSXUCEXP), which has significantly underperformed the broad market despite strong fundamental momentum.Fundamental Acceleration: Spending growth on consumer experiences accelerated from 1% in Q1 2025 to 6% in Q1 2026 (vs. 2% for broader services).
Higher-Income Insulation: High exposure to upper-income cohorts insulates the basket relative to low-end consumer discretionary space, providing resilience against elevated oil prices.
Non-Replicable AI Protection: While
GSXUCEXPrecently exhibited a negative correlation with AI, strategists expect this relationship to turn positive as physical, non-digitally-replicable real-world experiences command an increasing premium.
Disclaimer: The material provided is for information purposes only and should not be considered as investment advice. The views, information, or opinions expressed in the text belong solely to the author, and not to the author’s employer, organization, committee or other group or individual or company.
Past performance is not indicative of future results.
High Risk Warning: CFDs are complex instruments and come with a high risk of losing money rapidly due to leverage. 68% and 74% of retail investor accounts lose money when trading CFDs with Tickmill UK Ltd and Tickmill Europe Ltd respectively. You should consider whether you understand how CFDs work and whether you can afford to take the high risk of losing your money.
Futures and Options: Trading futures and options on margin carries a high degree of risk and may result in losses exceeding your initial investment. These products are not suitable for all investors. Ensure you fully understand the risks and take appropriate care to manage your risk.
Patrick has been involved in the financial markets for well over a decade as a self-educated professional trader and money manager. Flitting between the roles of market commentator, analyst and mentor, Patrick has improved the technical skills and psychological stance of literally hundreds of traders – coaching them to become savvy market operators!