S&P500 Daily Action Areas & Price Targets 20/11/26

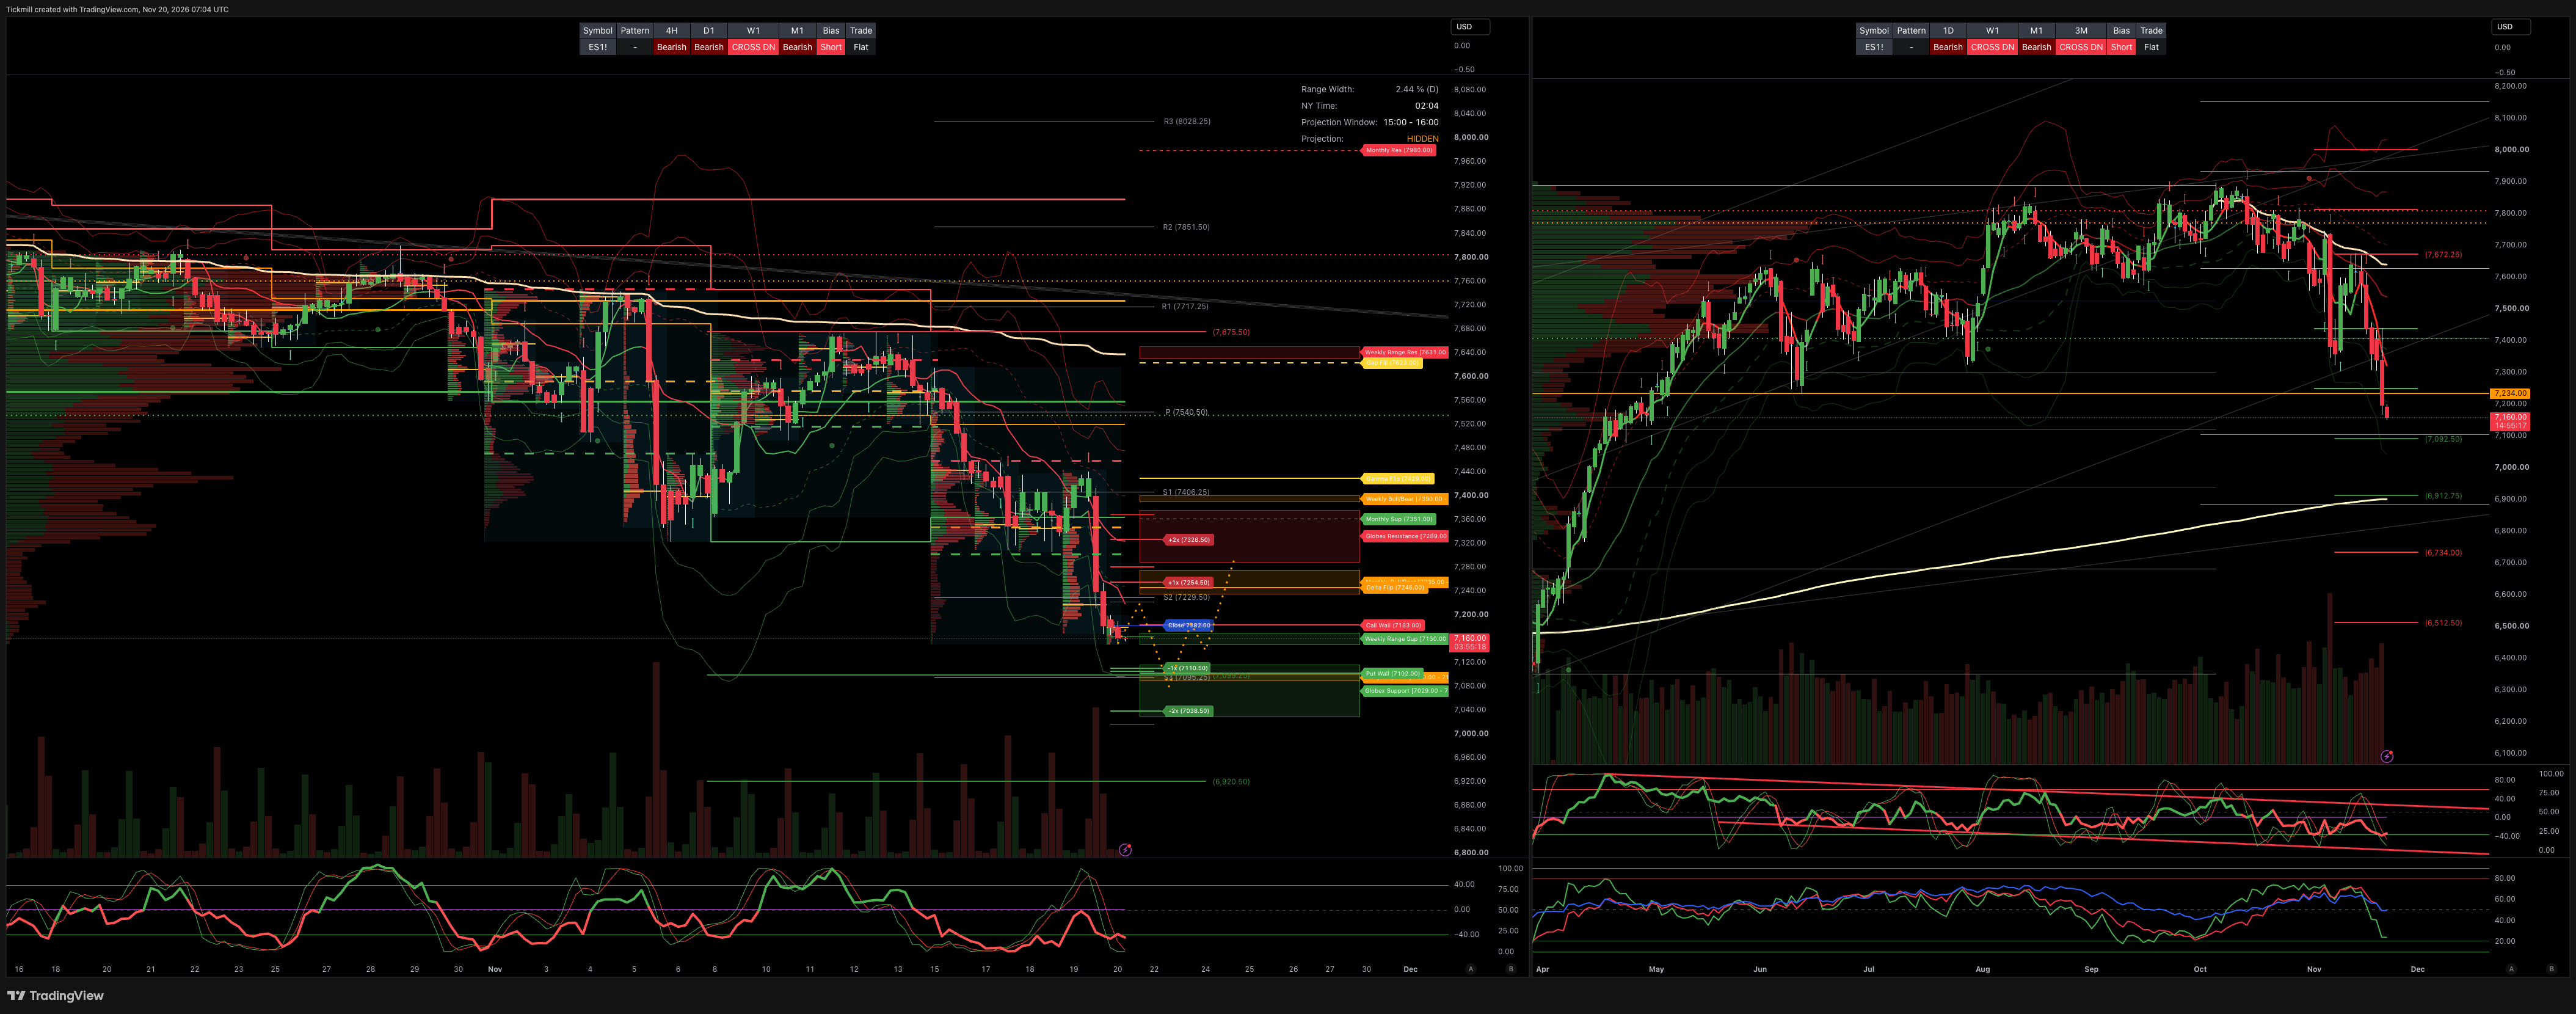
S&P500 Daily Action Areas & Price Targets 20/11/26
***QUOTING ES1!(Z CONTRACT LEVLES) FOR CASH US500 EQUIVALENT LEVELS, SUBTRACT POINT DIFFERENCE***
MONTHLY-WEEKLY& DAILY LEVELS
MONTHLY BULL BEAR ZONE 7275/35
MONTHLY RANGE RES 7980 SUP 7361
WEEKLY BULL BEAR ZONE 7400/7390
WEEKLY RANGE RES 7631/51 SUP 7170/50
DAILY BULL BEAR ZONE 7100/7090
GLOBEX RANGE SUP 7116/7029 RES 7289/7376
GAMMA FLIP 7429
DELTA FLIP 7246
CALL WALLS 7183
PUT WALLS 7102
DAILY STRUCTURE -
WEEKLY STRUCTURE - OTFL - 7674
MONTHLY STRUCTURE - OTFL
VIX BULL BEAR ZONE 22.75
VVIX-to-VIX ratio, currently hovering at approximately 4.47,falls within the historically typical range of 4.0 to 6.0. The lower ratio combined with a high VIX suggests near-term market stress is already being priced in, while demand for additional tail-risk protection on VIX remains relatively lower.
PRIMARY TRADES & TARGETS
LONG ON REJECT/RECLAIM DBBZ TARGET RTH CLOSE
***ADDITIONAL SETUPS & TARGETS HIGHLIGHTED ON THE CHARTS***
(I FADE TESTS OF 2 SIGMA LEVELS ESPECIALLY INTO THE FINAL HOUR OF THE NY CASH SESSION AS 90% OF THE TIME WHEN TESTED THE MARKET WILL CLOSE ABOVE OR BELOW THESE LEVELS)
SPX PUT/CALL RATIO 1.21 (The numbers reflect options traded during the current session.) A put-call ratio below 0.7 is generally considered bullish, and a put-call ratio above 1.0 is generally considered bearish.
JHEQX Upside cap (~7,920–7,950): Dealer gamma hedging at this call strike creates resistance, with market makers likely selling futures into strength and limiting volatility. Downside cushion (~7,270): If SPX drops 5% into Q4, long put gamma may force dealers to buy futures as the index falls, helping stabilize prices. Expiration: December 31, 2026. Strong pinning effects are likely near key strikes into year-end expiration.
DEC2025 OPEX to DEC2026 OPEX is 945 points giving us a range of [5889,7779]
Notes On Structure Implications
Balance: This refers to a market condition where prices move within a defined range, reflecting uncertainty as participants await further market-generated information. Our approach to balance includes favouring fade trades at the range extremes (highs/lows) while preparing for potential breakout scenarios if the balance shifts.
One-Time Framing Higher (OTFH): This represents a market trend where each successive bar forms a higher low, signalling a strong and consistent upward movement.
One-Time Framing Lower (OTFL): This describes a market trend where each successive bar forms a lower high, indicating a pronounced and steady downward movement.
NOMURA TRADING DESK VIEWS
NOMURA CROSS-ASSET STRATEGY BRIEFING: "THE MECHANICAL RELIEF RALLY MAKES TOO MUCH SENSE—AND THAT'S A PROBLEM"
Charlie McElligott highlights a critical structural paradox: the setup for a mechanical, volatility-reset relief rally following this week's "Quad-fecta" of risk events (Nvidia earnings, Ant Group IPO, monthly VIX expiration, and standard OpEx) is so textbook and hyper-socialized across institutional desks that its universal consensus is now its single largest vulnerability. Because "nobody has any net on" after a brutal year of performance, desks view an upside "pain-trade rally" as the path of least resistance—leaving the market fragile and exposed to "sellers are lower" air-pocket risk if spot fails to stabilize by early next week.
Beneath the tactical options mechanics, McElligott warns of a potentially historic regime shift: 401(k) household investors and Real Money asset allocators are rotating out of equities into cash ("the original Put") and rebalancing into Fixed Income, drawn by attractive real yields as Treasury bonds re-establish their efficacy as a risk-asset hedge. Simultaneously, the AI macro narrative is being reset flatter—both from post-election data-center pushback and Nvidia transitioning from the ecosystem's de facto "Long Put" ("Central Bank of AI") into a perceived "Short Put" as financing commitments face delays.
CROSS-ASSET MACRO & FACTOR RE-GROSSING SIGNALS
Month-to-Date "Growth Scare" & Financial Conditions Tightening:
Cross-asset tape has repriced a fatter left-tail growth scare alongside aggressive de-grossing: Bloomberg Commodity Index (
BCOM) -8.5% MTD, Energy -13.4% MTD, Industrial Metals -8.0% MTD (with high-profile macro shorting in Copper), rallying US Treasuries, and a violent unwind of Momentum/Mega-Cap Tech into Defensives and Anti-Beta.US Financial Conditions are tightening rapidly via elevated real rates, wider credit spreads, and an equity realized-volatility shock—creating mounting concern over a negative wealth effect given equities' record share of US household net worth.
Intraday "Signs of Life" Re-Grossing (Thursday Morning Factor Moves):
Legacy AI & Hardware Rebound:
DRAM+5.0%, AI Long-Short basket +4.3%, Semiconductors +3.4%, Retail Favorites +3.2%.High-Beta & Cyclical Rotation: Cyclicals vs. Defensives +3.2% (+2.0 z-score 1-day move); "Animal Spirits" (Leveraged ETF Heavyweights) vs. SPX +2.8% (+1.5 z-score).
Factor & Index Spreads: 1-Year Momentum +2.0% (+1.3 z-score); 1-Month Reversal Factor +2.0 z-score; Nasdaq-100 vs. SPX +1.7 z-score; SPX Equal Weight vs. SPX -2.3 z-score.
DERIVATIVES MECHANICS: SHORT GAMMA OVERHANG, VANNA FUEL & CTA TRIGGERS
Post-OpEx Dealer Gamma Profile (Still Short Gamma):
Counterintuitively, a substantial portion of the gamma rolling off in Friday's standard Options Expiration is dealer Long Gamma—removing a stabilizing buffer while leaving dealers net Short Gamma into next week due to persistent customer year-end put hedges.
With 60-day realized volatility of
VVIXsitting at 2-year highs, this residual short-gamma posture continues to fuel wide, pro-cyclical two-way swings unless systematic vol sellers (such as QIS VRP 0DTE overwriting, which has begun picking up again) expand supply.
The "Vanna" Rally Fuel:
Because customer year-end downside puts remain open and unmonetized on dealer books, clearing the Quad-fecta event risk allows elevated implied volatility,
VVIX, and steep put skew to reset lower.As implied volatility drops, customer puts lose delta—mechanically forcing dealers to buy back short futures hedges unemotionally.
Systematic Trend & Vol-Control Follow-Through:
CTA Trend Triggers: Meaningful global equity futures buy triggers cluster at +2.0% and +4.0% above Wednesday’s closing levels as short-term trend windows flip back from short to long.
Vol-Targeting Funds: A sustained compression in 1-month and 3-month realized volatility will gradually compel Vol Scaler / Target Volatility funds to re-add equity length over subsequent weeks.
OPTIONS SURFACE FLOWS & ACTIONABLE TRADING IMPLICATIONS
Observed "Fear of the Spot Rally / Vol Dip" Flows:
Index OTM call skew has begun perking up for the first time in weeks, accompanied by aggressive institutional accumulation of VIX downside put spreads:
Buyer of 40,000 VIX Jan 20/19 Put Spreads at $0.54
Buyer of 14,000 VIX Dec 19/16 Put Spreads at $0.79
Buyer of 11,000 VIX Dec 19/16 Put Spreads at $0.87
Buyer of 4,000 x 8,000 VIX Dec 19/17 1x2 Put Spreads at $0.46
Buyer of VIX Dec 22/19 Put Spreads at $1.73 (vs. spot VIX ~22)
Key Strategic Takeaways & Warning Signal:
Re-Enter Volatility Dispersion: Following a painful 1-week index volatility squeeze, positioning back into Index Vol vs. Single-Name Vol dispersion offers an attractive way to monetize normalizing index correlation as single-stock thematic dispersion resumes.
The Early-Next-Week Litmus Test: If US equities fail to stabilize and rally by early next week despite clean event clearing, mechanical Vanna futures buybacks, and clustered CTA triggers, treat it as confirmation that VaR-constrained hedge funds and 401(k)/Real-Money fixed-income reallocators are actively liquidating risk—breaking the 15-year Pavlovian "buy the dip, sell the vol rip" regime.
Disclaimer: The material provided is for information purposes only and should not be considered as investment advice. The views, information, or opinions expressed in the text belong solely to the author, and not to the author’s employer, organization, committee or other group or individual or company.
Past performance is not indicative of future results.
High Risk Warning: CFDs are complex instruments and come with a high risk of losing money rapidly due to leverage. 68% and 74% of retail investor accounts lose money when trading CFDs with Tickmill UK Ltd and Tickmill Europe Ltd respectively. You should consider whether you understand how CFDs work and whether you can afford to take the high risk of losing your money.
Futures and Options: Trading futures and options on margin carries a high degree of risk and may result in losses exceeding your initial investment. These products are not suitable for all investors. Ensure you fully understand the risks and take appropriate care to manage your risk.
Patrick has been involved in the financial markets for well over a decade as a self-educated professional trader and money manager. Flitting between the roles of market commentator, analyst and mentor, Patrick has improved the technical skills and psychological stance of literally hundreds of traders – coaching them to become savvy market operators!