S&P500 Daily Action Areas & Price Targets 9/7/26

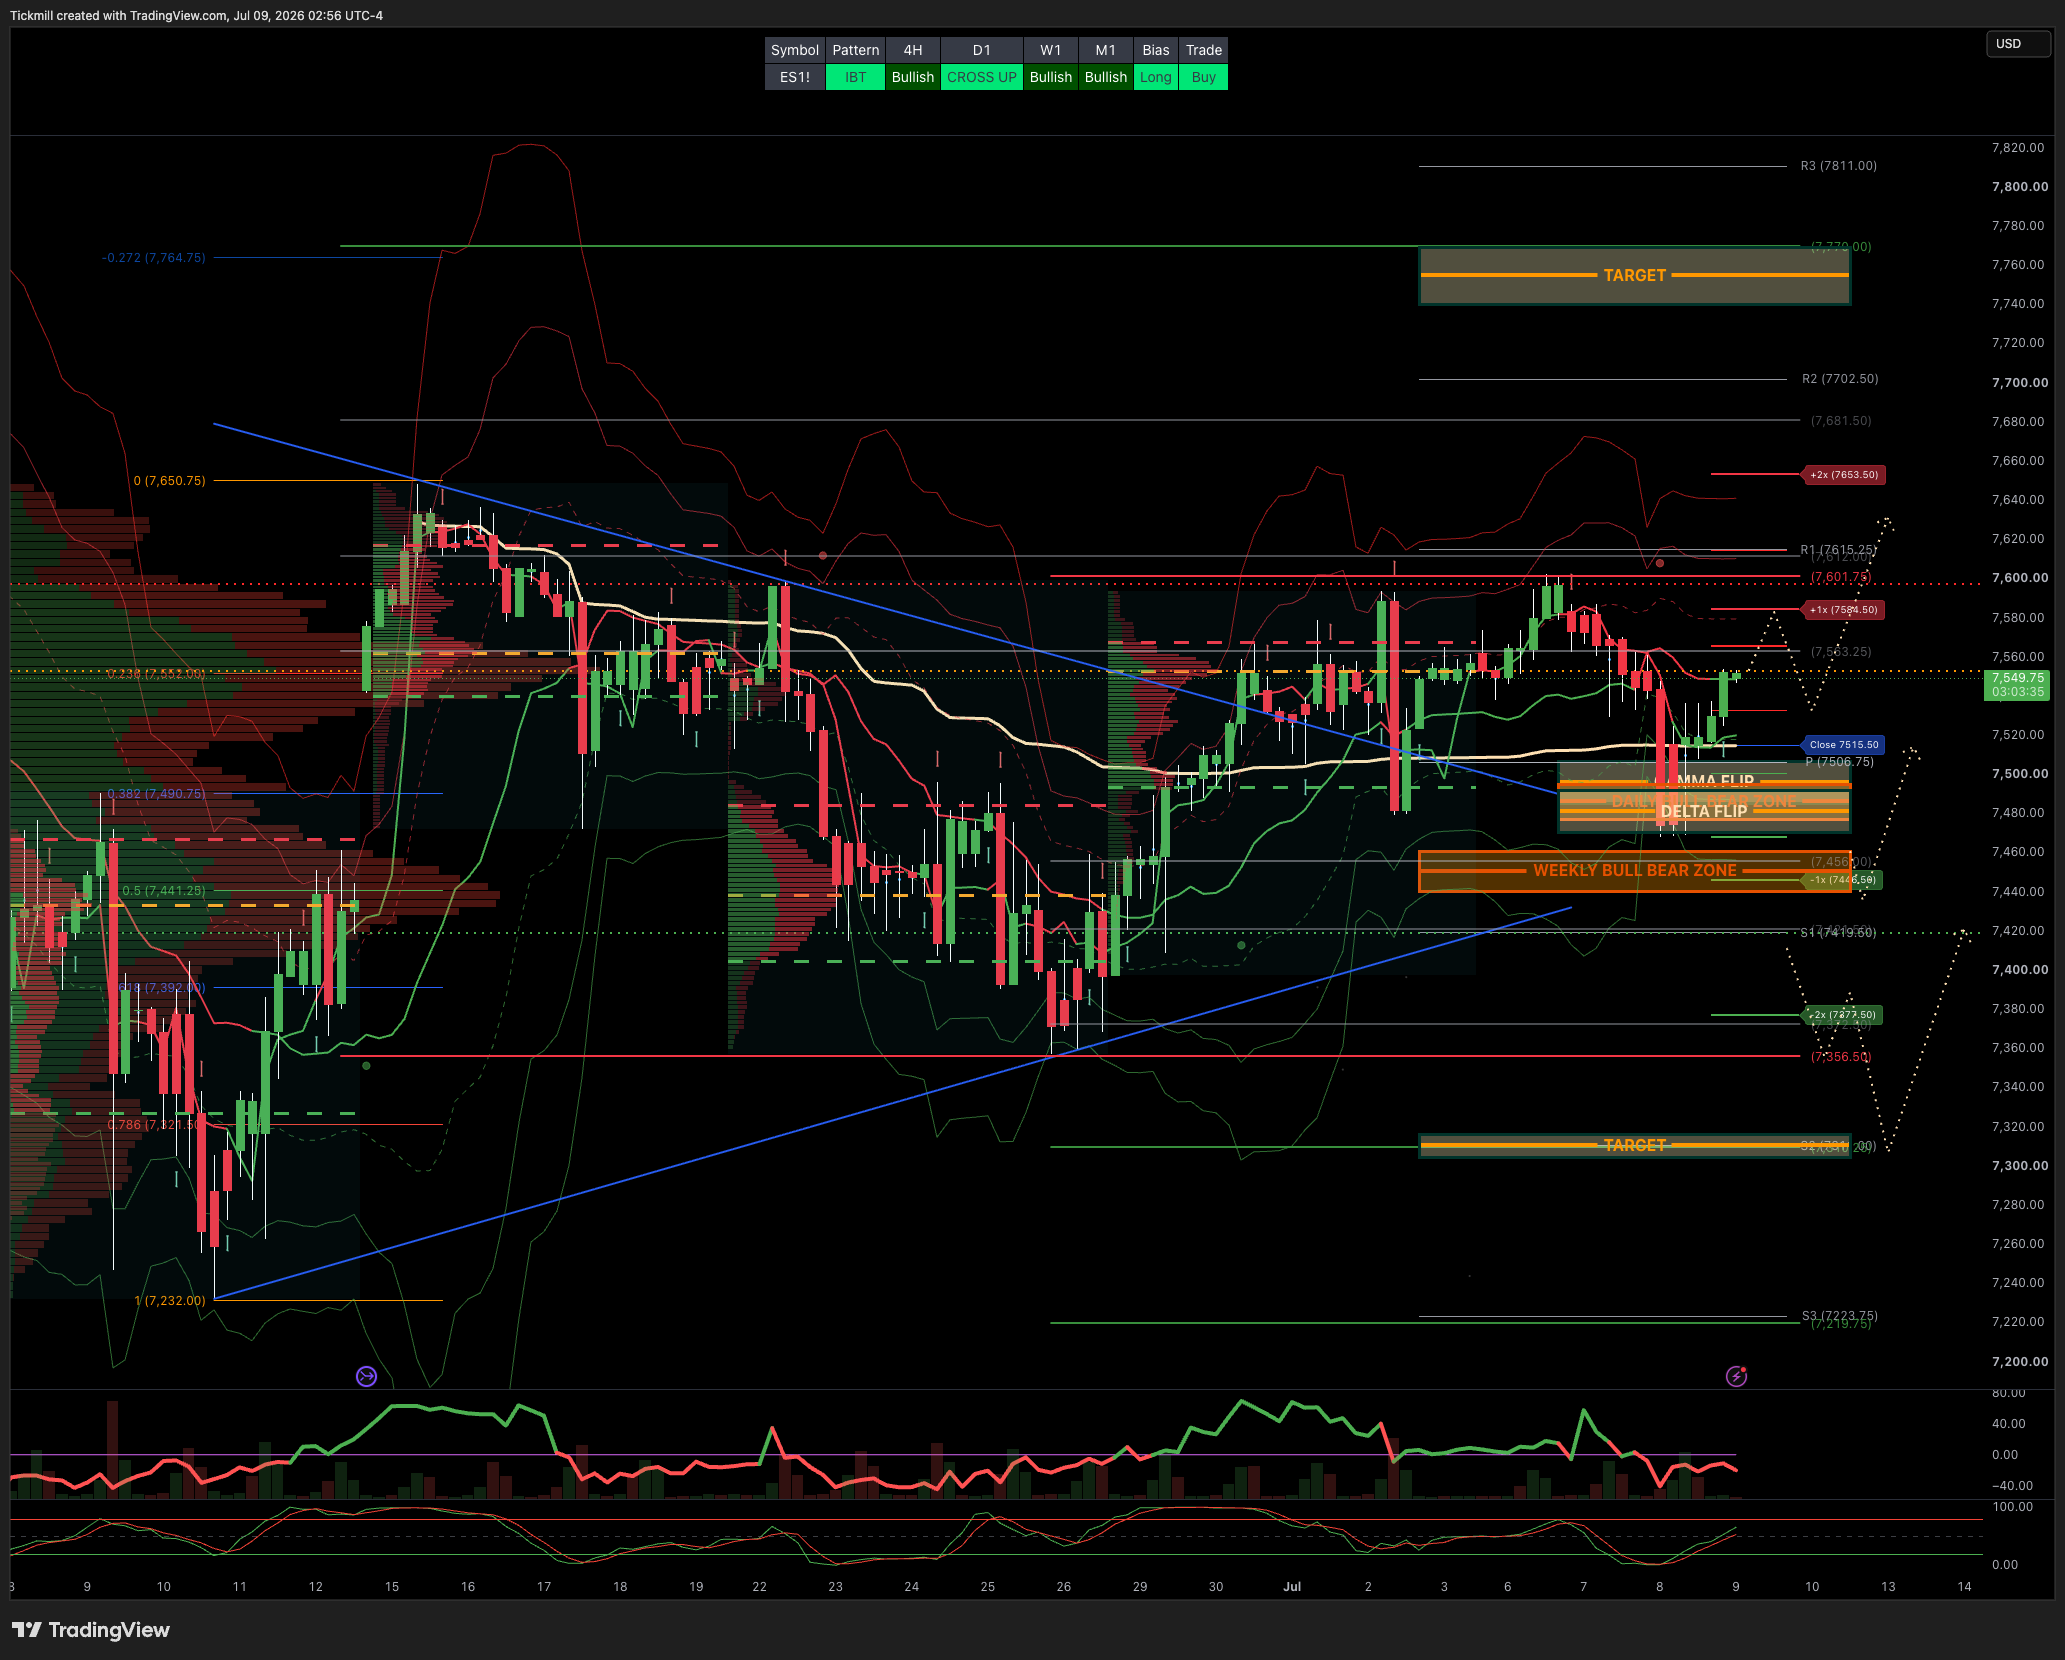
S&P500 Daily Action Areas & Price Targets 9/7/26
***QUOTING ES1! FOR CASH US500 EQUIVALENT LEVELS, SUBTRACT POINT DIFFERENCE***
WEEKLY BULL BEAR ZONE 7460/40
WEEKLY RANGE RES 7628 SUP 7428
MONTHLY RANGE RES 7932 SUP 7384
JHEQX Q3 Collar Short Call Cap: ~7,750 – 7,900 - Long Put Strike: ~7,050 – 7,100 (approx. 5% downside protection) Short Put Strike: ~5,950
DEC2025 OPEX to DEC2026 OPEX is 945 points giving us a range of [5889,7779]
SPX PUT/CALL RATIO 1.12 (The numbers reflect options traded during the current session.) A put-call ratio below 0.7 is generally considered bullish, and a put-call ratio above 1.0 is generally considered bearish.
GS Flow Desk: large S&P 31Aug 7000/7950 strangle in roughly $20mm vega / $115mm premium …My Read – classic “big convexity versus carry” trade: either someone paid a lot to own a wide August move, or someone got paid a lot to bet that the S&P stays comfortably inside the 7000–7950 corridor
DAILY VWAP BULLISH 7550
WEEKLY VWAP BULLISH 7476
MONTHLY VWAP BULLISH 7036
DAILY STRUCTURE - BALANCE 7602/7479
WEEKLY STRUCTURE - BALANCE 7648/7247
MONTHLY STRUCTURE - OTFH - 7199
Balance: This refers to a market condition where prices move within a defined range, reflecting uncertainty as participants await further market-generated information. Our approach to balance includes favouring fade trades at the range extremes (highs/lows) while preparing for potential breakout scenarios if the balance shifts.
One-Time Framing Higher (OTFH): This represents a market trend where each successive bar forms a higher low, signalling a strong and consistent upward movement.
One-Time Framing Lower (OTFL): This describes a market trend where each successive bar forms a lower high, indicating a pronounced and steady downward movement.
DAILY BULL BEAR ZONE 7495/85 LONGS ACTIVE FROM THIS ZONE YESTERDAY
GAMMA FLIP 7552
DELTA FLIP 7481
DAILY RANGE RES 7585 SUP 7446
2 SIGMA RES 7654 SUP 7377
VIX BULL BEAR ZONE 17.4
TRADES & TARGETS
LONG ON REJECT/RECLAIM DAILY BULL BEAR ZONE TARGET CLOSE > DAILY RANGE RES
***ADDITIONAL SETUPS & TARGETS HIGHLIGHTED ON THE CHARTS***
(I FADE TESTS OF 2 SIGMA LEVELS ESPECIALLY INTO THE FINAL HOUR OF THE NY CASH SESSION AS 90% OF THE TIME WHEN TESTED THE MARKET WILL CLOSE ABOVE OR BELOW THESE LEVELS)
GOLDMAN SACHS FICC & EQUITIES TRADING DESK VIEWS
US equities had a choppy session as an attempted stabilization in AI and momentum was offset by a renewed macro/geopolitical shock from the Middle East. The S&P 500 fell 28bps to 7,482, the NDX gained 27bps to 29,252, the Russell 2000 dropped 111bps to 2,949, and the Dow lost 109bps to 52,348. Volumes remained light at 17.677bn shares versus a YTD daily average of 19.676bn, and the close saw only a $105mm MOC to buy, effectively insignificant. Cross-asset price action was less benign: VIX rose 403bps to 16.8, WTI jumped 530bps to $74.17, Brent rose more than 6% to $78.85, the 10-year yield moved up to 4.5691%, gold fell 66bps to 4,079, DXY was little changed at 100.99, and Bitcoin fell 228bps to $62,200.
The key shift was that just as the AI and momentum unwind appeared to be stabilizing, with the high beta momentum pair up 378bps, the market was handed a new wall of worry in the form of renewed geopolitical uncertainty. Trump declaring the Iran ceasefire over after fresh attacks triggered early selling pressure and a sharp bid to crude. This is potentially more important than prior escalation headlines because oil positioning has moved to an outright short extreme, with Brent shorts reportedly reaching a new record in late June. If the escalation continues, the risk is that crude price action becomes violent to the upside, not necessarily because the fundamental supply shock is immediately severe, but because positioning is vulnerable and the market is poorly set up for an upside oil squeeze.
The combination of higher oil and higher yields was the most problematic macro input for equities. It directly challenges the post-NFP relief narrative, which had been built on lower hike risk, contained energy prices, and a broadening equity tape. Consumer pockets traded heavy as a result, and the market is now looking toward Pepsico’s Q2 report with caution. Expectations are for a potential miss, with management possibly pointing toward the lower end of FY26 guidance. That matters because consumer resilience remains a key pillar of the broader soft-landing thesis. If rising fuel prices and higher rates begin to pressure consumer-facing earnings at the same time, the equity market’s ability to broaden beyond tech becomes more fragile.
The AI rotation remained active, especially overseas. Korea remains a key pressure point, with the KOSPI entering a technical bear market, down 23% from its peak, as the rotation out of Korean chipmakers accelerates. That is important because Korea had been one of the cleanest global expressions of the AI infrastructure and memory trade. A technical bear market there reinforces the idea that the first-half AI bottleneck winners are still being de-risked, even if US momentum managed a tactical bounce on the day. Overnight Korean price action remains a key tell for whether the AI unwind is stabilizing or simply pausing.
The prime brokerage update reinforces that the pain is still concentrated in momentum, crowded trades, and AI exposure. Systematic long/short managers are down 3.6% since June 22, their worst drawdown since summer 2025, giving back roughly a quarter of their YTD performance. They are now up 10.8% YTD versus 14.4% on June 22. Losses have been led by the short side of portfolios, especially in US equities, followed by developed Asia and Europe, with momentum and crowded trades among the main negative drivers. This confirms that the unwind is not just about long AI winners falling; it is also about laggards and shorts squeezing.
Fundamental long/short managers are down 2.2% since June 22, including 0.8% of negative alpha, but remain up a strong 15.5% YTD. Info Tech and momentum have been the main sources of negative alpha, and managers are aggressively cutting AI long exposure that had driven essentially all of their YTD alpha through June 22. That selling has materially reduced their momentum exposure and pushed gross leverage down to the bottom decile over the past year. In other words, the market is seeing real de-risking from the funds most exposed to the first-half AI trade, but it is profit-protection de-risking from a strong YTD position rather than forced liquidation from poor absolute performance.
Flows were quiet, consistent with the light-volume and choppy tape. The floor was a 4 out of 10 in terms of activity and finished 210bps for sale versus a 30-day average of 38bps to buy. NDX volumes were tracking down more than 20%, and inbound activity was muted. Asset managers were roughly flat with no major sector skew, while hedge funds finished net buyers, driven by demand in tech and energy. The hedge fund demand in tech is notable because it suggests some tactical dip-buying or re-risking after the AI/momentum drawdown, while energy demand reflects the new geopolitical/oil squeeze risk.
The derivatives tape was calmer than the headlines might suggest. SPX and NDX fixed-strike vols were little changed despite the geopolitical noise and moderate spot moves. RUT spot and vol traded positively correlated, with both ending lower, which points to small-cap-specific stress rather than broad panic. Skew was bid across the board, particularly in the front end of SPX, indicating investors are still looking for downside protection even though outright index vol is not breaking higher. The fact that skew is bid while fixed-strike vol is relatively stable fits a market that is worried about tails but not yet in a full volatility event.
The NDX-SPX volatility spread remains a key expression of the current regime. QQQ has lagged SPY over the past week, and the NDX-SPX implied vol spread remains historically elevated around 11 vols while realizing 16 vols over the past month, a multi-decade extreme. That suggests the market is still pricing, and realizing, unusually large differentiation between mega-cap/growth/AI-heavy indices and the broader S&P. Given that backdrop, short-dated QQQ puts remain a clean way to express continuation of the recent relative weakness in tech-heavy indices, particularly with earnings and macro data ahead.
The single-name and thematic options tape was more nuanced. Momentum remained in focus despite the recent unwind, and the high beta pair closed up more than 3.5%. Customers came in to buy call spreads on the long leg of the pair, suggesting some investors are looking for a defined-risk bounce after the sharp drawdown. There were also bullish implementations in semis and software, which points to selective re-engagement with tech rather than wholesale abandonment. At the same time, more bearish expressions appeared in energy and financials, likely reflecting concern that the oil spike and yield move could pressure broader cyclicals and rate-sensitive financial exposures.
Given the S&P closed at 7,482 and the implied move through tomorrow is 0.61%, the options market is pricing roughly a 46-point move in either direction. That implies an approximate one-session range of 7,436 to 7,528. A move above 7,528 would suggest the market is able to absorb the oil/geopolitical shock and continue the momentum/tech stabilization attempt. A move below 7,436 would be more concerning, particularly if driven by another leg higher in crude, a further rise in yields, or renewed pressure in Korea and semis. The current close near the middle of that range shows the options market is not pricing a major index break yet, even though the macro and factor backdrop has clearly become more complicated.
Disclaimer: The material provided is for information purposes only and should not be considered as investment advice. The views, information, or opinions expressed in the text belong solely to the author, and not to the author’s employer, organization, committee or other group or individual or company.
Past performance is not indicative of future results.
High Risk Warning: CFDs are complex instruments and come with a high risk of losing money rapidly due to leverage. 69% and 73% of retail investor accounts lose money when trading CFDs with Tickmill UK Ltd and Tickmill Europe Ltd respectively. You should consider whether you understand how CFDs work and whether you can afford to take the high risk of losing your money.
Futures and Options: Trading futures and options on margin carries a high degree of risk and may result in losses exceeding your initial investment. These products are not suitable for all investors. Ensure you fully understand the risks and take appropriate care to manage your risk.
Patrick has been involved in the financial markets for well over a decade as a self-educated professional trader and money manager. Flitting between the roles of market commentator, analyst and mentor, Patrick has improved the technical skills and psychological stance of literally hundreds of traders – coaching them to become savvy market operators!